Of all the early Copilot features in Excel, Advanced Analysis with Python was the one that made me think we were looking at the future of the spreadsheet. You could describe an analytical question, have Copilot write Python, and work with the results right in the Excel grid. That opened up a much bigger set of possibilities than asking AI to help format a column.
I was fairly public about my enthusiasm. I called Excel, Copilot and Python the new trinity of data analysis, and I made Advanced Analysis a centerpiece of my Global Excel Summit plans. I also wrote walkthroughs on regression, decision trees, optimization and plenty more. There are receipts. Quite a few receipts.
Then the feature disappeared for a while. When you have put that much work into teaching something, finding that its entry point has vanished is a fairly effective way to interrupt your morning.
The good news is that Copilot can once again create Python in Excel analysis, now through the python-in-excel skill. I am glad to see it back, and I think its new home offers something more interesting than a replacement button: we can bring Python analysis together with the instructions, context and reusable procedures we are already giving Copilot.
What went away, and what came back?
Microsoft’s February 24, 2026 transition announcement explained that the older App Skills experience was being consolidated into Copilot Chat and Agent Mode. It specifically identified Advanced Analysis using Python in Excel as a scenario that was not yet available in those replacement experiences. The change was intended to unify Copilot’s different entry points, but this particular workflow was left in the gap.
That distinction matters: Python in Excel itself did not disappear. The missing piece was the Copilot experience that helped people build those Python analyses conversationally. You could still have Python formulas in a workbook while being unable to follow an older Advanced Analysis tutorial’s Copilot steps.
In its August 2026 Excel update, Microsoft announced a Python skill that creates editable, refreshable Python formulas directly in the workbook, invoked with @python-in-excel. That announcement labeled it an Insider feature. The August 25 Copilot release notes also describe Python support while editing in Excel.
So there was a real interruption of several months between the documented transition and the return announcement. I would describe this as a capability returning in a new Copilot experience, rather than assume every detail of the old Advanced Analysis mode has been restored.
Why a skill is an interesting place for Python
A skill gives Copilot a reusable set of instructions for a particular kind of work. Instead of explaining an entire procedure in each new conversation, you can ask for the skill that describes it. Microsoft supplies some skills; you can also create your own. My introduction to Copilot skills walks through that distinction.
Microsoft’s current skills documentation describes selecting a skill from the prompt’s Add menu under Choose plugins and skills, or invoking it with an @mention. Some builds expose management through Manage skills or Manage plugins & skills in the pane’s settings menu. The names move around; the important thing is to select the actual Python in Excel skill available to your account.
For me, the biggest opportunity is combining that analytical capability with context that already has a home:
| Layer | What it contributes to this analysis |
|---|---|
| Personalization | Your general preferences, such as plain-English explanations and clearly labeled units. |
| Workbook instructions | This file’s definitions, missing-data rules, source table and output location. |
| Grounding | The actual observations and reference material Copilot can read to support the work. |
| Skills | A reusable analytical procedure, including Microsoft’s Python in Excel capability and, when useful, a custom review procedure. |
In a business workbook, those definitions might be your approved margin calculation or which transactions belong in the reporting period. Here, they will tell Copilot what a penguin measurement means and how to handle a missing one. A little less quarterly close, a little more Antarctic fieldwork.
This is my reason for being interested in the new arrangement. It does not guarantee that several instructions will combine perfectly, and it does not make a skill a substitute for checking the analysis. It gives those instructions a place to live alongside the Python capability, so we can review the result against something more specific than “that looks about right.”
Set up the Penguins workbook
For this walkthrough, I am returning to the Palmer Penguins dataset, which I also used in my original Advanced Analysis introduction. It contains observations of Adelie, Chinstrap and Gentoo penguins, with measurements such as body mass and flipper length. The data were collected by Dr. Kristen Gorman and the Palmer Station Long Term Ecological Research Program and made conveniently available through the palmerpenguins project.
Download the starting workbook and copy-ready prompts. You can also browse this post’s standalone GitHub repository. No GitHub account is needed for the public download.
Extract the ZIP and open penguins-python-skill.xlsx. Work in a copy. The Penguins worksheet contains a table named Penguins, with 344 observations. The Analysis worksheet has an island dropdown in B3, initially set to All. The third sheet, .Rules, contains instructions for this workbook.
Source NA entries are represented as blank cells. Leave them blank. A missing body-mass measurement is not a zero-gram penguin, however much that would simplify the baggage allowance.
You need access to Copilot workbook editing, the Python in Excel skill, and Python in Excel itself. Save the working copy to OneDrive or SharePoint if your Copilot experience requires it. Availability depends on your account, platform and rollout, so check Microsoft’s Python in Excel availability page if something is missing. The separate Python in Excel add-on concerns premium compute and additional calculation modes; it is not the same entitlement as Copilot. Microsoft’s add-on FAQ explains that distinction.
Give the analysis context before asking for results
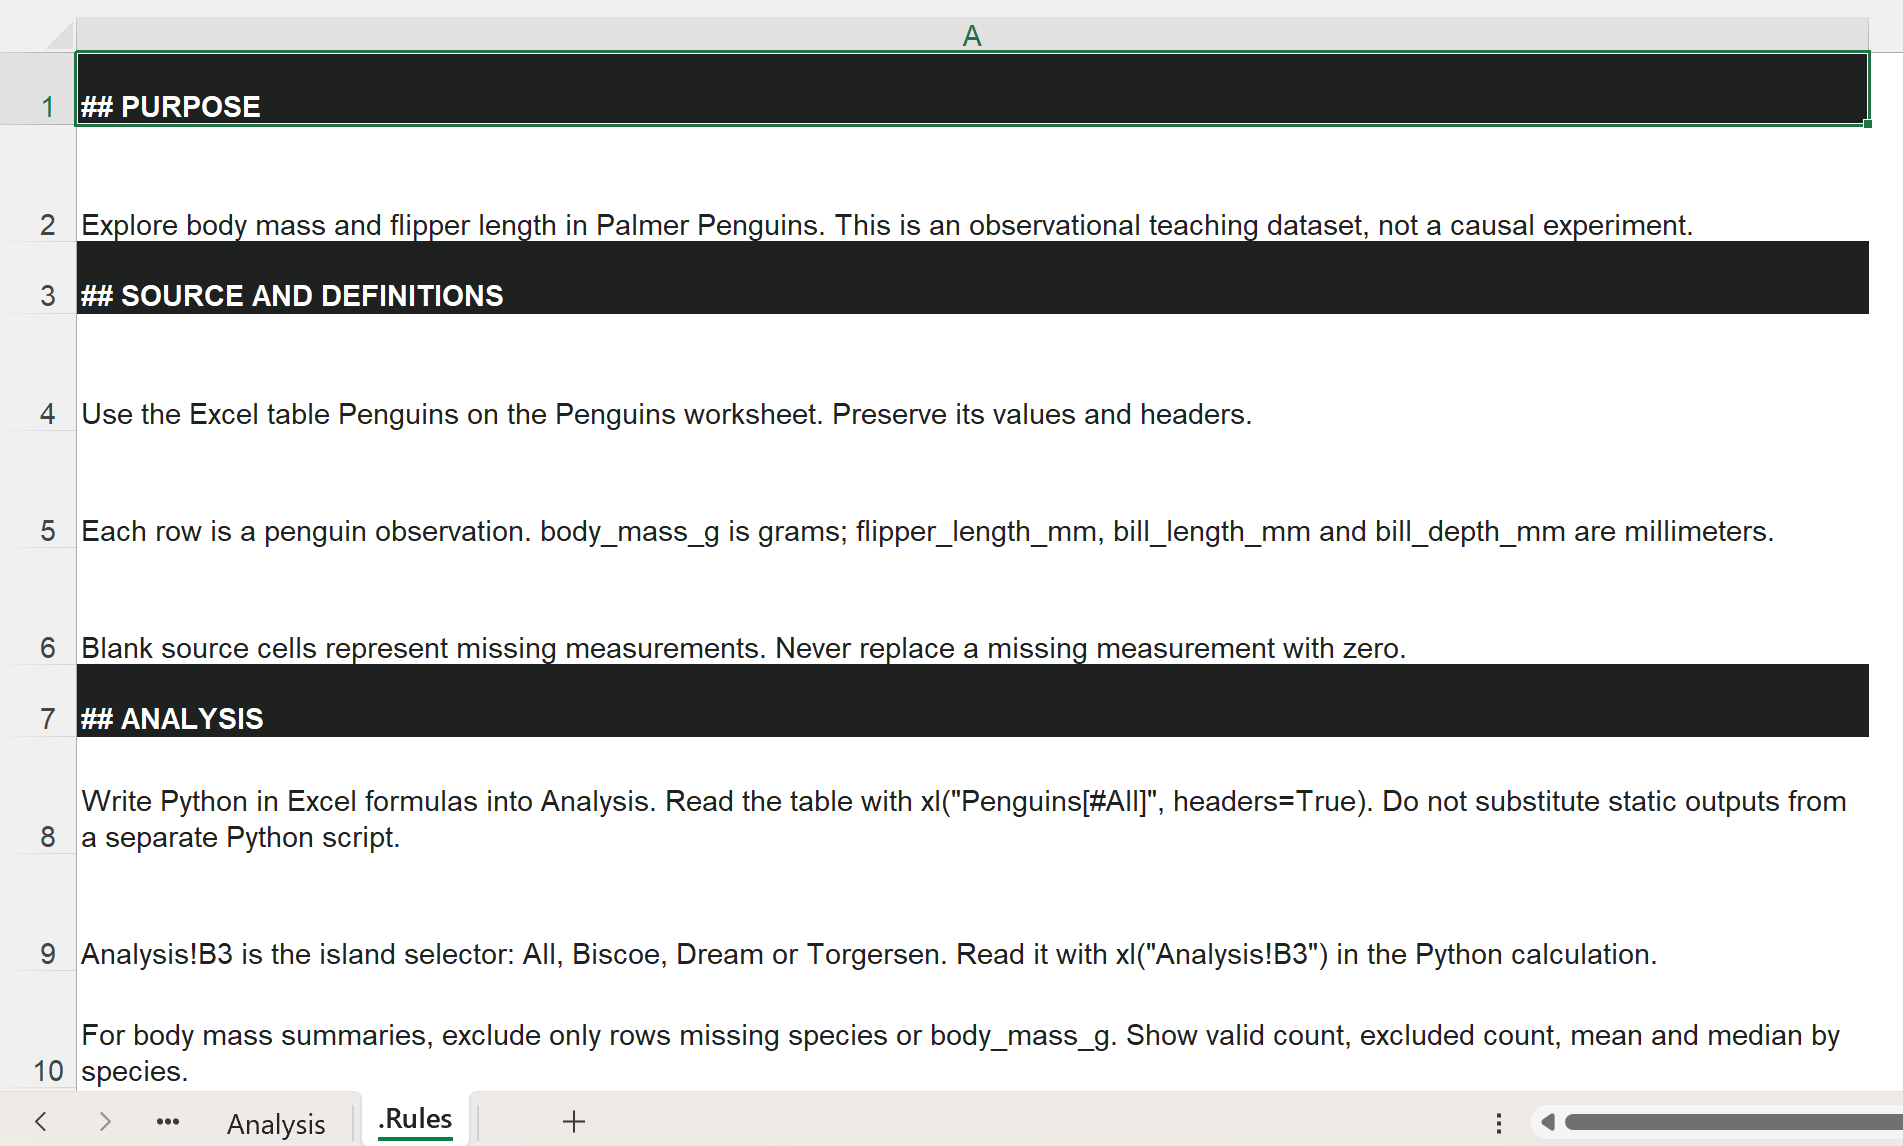
Open .Rules and read it. The rules identify the source table, define grams and millimeters, preserve missing values, and reserve Analysis!B3 as the island selector. They also tell Copilot to create Python in Excel formulas and keep the original data unchanged.
The sheet name and layout are deliberate. Microsoft specifies a visible worksheet named .Rules, with the instructions in column A. Those instructions travel with the workbook. Hiding the sheet prevents Copilot from using it as a rules worksheet.
Personalization has a different scope. In the Copilot pane’s settings, Personalization can hold preferences such as:
Explain analytical choices in plain English. Include sample sizes and units. Separate observed associations from causal claims.Those are sensible preferences across many analyses. “Use the Penguins table” belongs to this workbook instead. If you already have personalization instructions, keep them; do not replace them wholesale for this exercise. Microsoft documents how personalization follows your account, and I have a separate comparison of personalization and workbook rules.
For grounding, this small example uses the actual table and its workbook definitions. We are not asking Copilot to remember some generic version of Penguins from its training data. In a work project, you could also supply an approved data dictionary or methodology document through the available work-content controls, then ask Copilot to identify what it can actually read. Referencing a file by name does not establish that it was accessible.
Open Copilot and start with this context check:
Read the Penguins table, the visible .Rules worksheet, and the island selector in Analysis!B3. Briefly identify the source, measurement units, missing-data rule and output location before making changes. Confirm that @python-in-excel is available. If it is unavailable, stop and explain rather than substituting a separate Python script.In my run, Copilot correctly identified the 344-row source, the measurement units, the missing-data rule and the output location. It also confirmed Python in Excel was available. That is a useful first check before handing it a more involved analysis.
Ask for a summary you can inspect
With the island selector still set to All, send the next prompt:
@python-in-excel Follow this workbook's .Rules. On Analysis below row 7, create a Python in Excel summary of body_mass_g by species for the island selected in Analysis!B3. Show valid observations, excluded observations, mean body mass and median body mass. Use xl() to reference the Penguins table and B3 so the result recalculates when B3 changes. Return the summary as Excel values. Keep the source data unchanged. Identify the Python cell and briefly explain the missing-data handling.There are several useful constraints here. We have named the analysis, specified the grouping, and asked for the number of observations behind each result. We also want the output as Excel values so it can spill into a readable worksheet range, while the originating Python cell keeps the code.
Here are the figures to check against the supplied data, rounded to one decimal place for the averages:
| Species | Valid mass measurements | Excluded | Mean mass, g | Median mass, g |
|---|---|---|---|---|
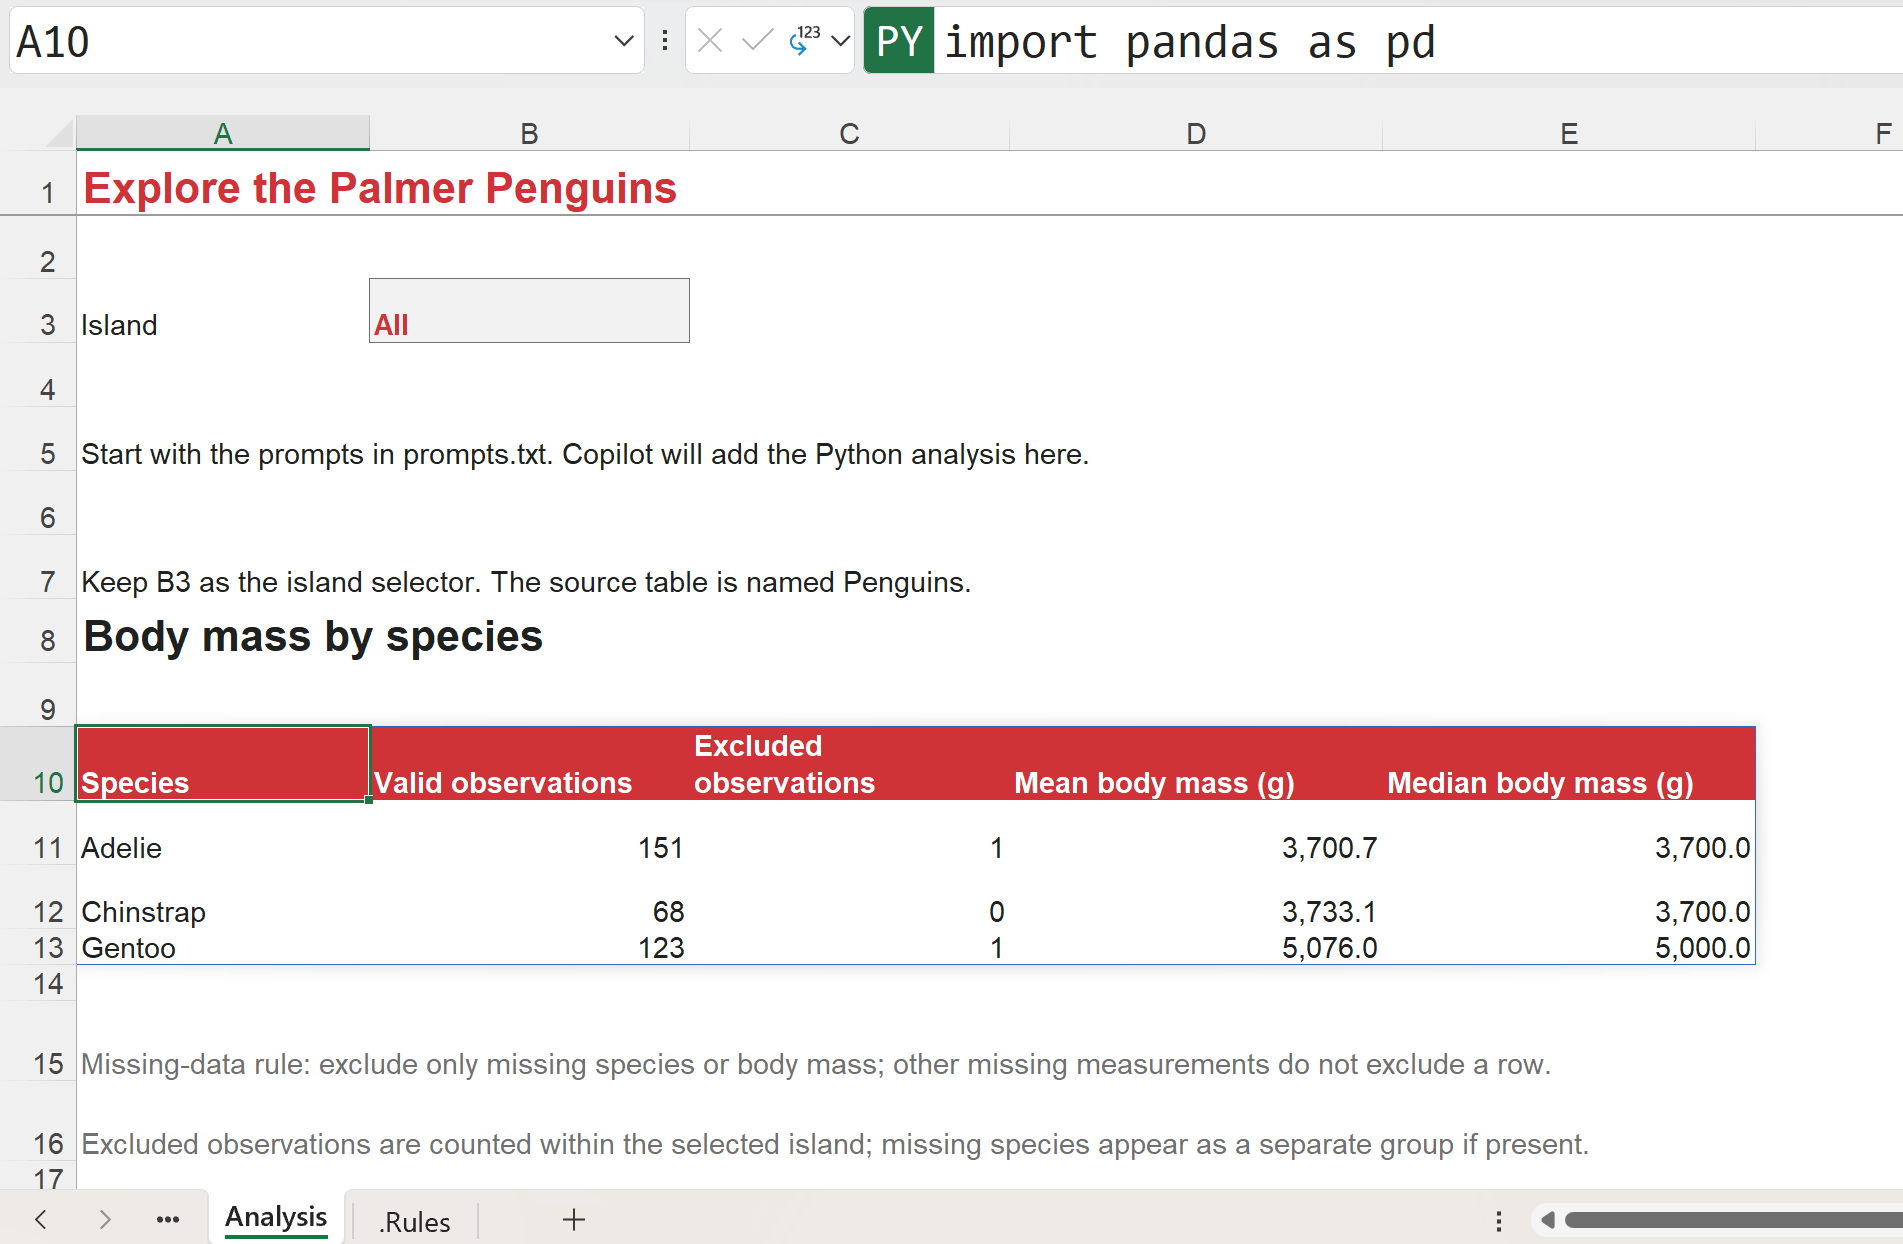
| Adelie | 151 | 1 | 3,700.7 | 3,700 |
| Chinstrap | 68 | 0 | 3,733.1 | 3,700 |
| Gentoo | 123 | 1 | 5,076.0 | 5,000 |
There are 342 valid body-mass observations. If you get 333, inspect the missing-data logic: that is the complete-case count when you require every field in this dataset, including sex. Sex is not needed to calculate this summary, so dropping rows because it is missing would discard useful measurements.
My run produced these results in Analysis!A10:E13, with the Python formula in A10. Your layout may differ; use the cell Copilot identifies in your own workbook.
Click the Python cell Copilot identifies. On supported versions, Formulas > Python > Editor opens the Python code editor, where you can inspect the workbook’s Python cells. You should find references to the source table and selector, conceptually like:
penguins = xl("Penguins[#All]", headers=True)
island = xl("Analysis!B3")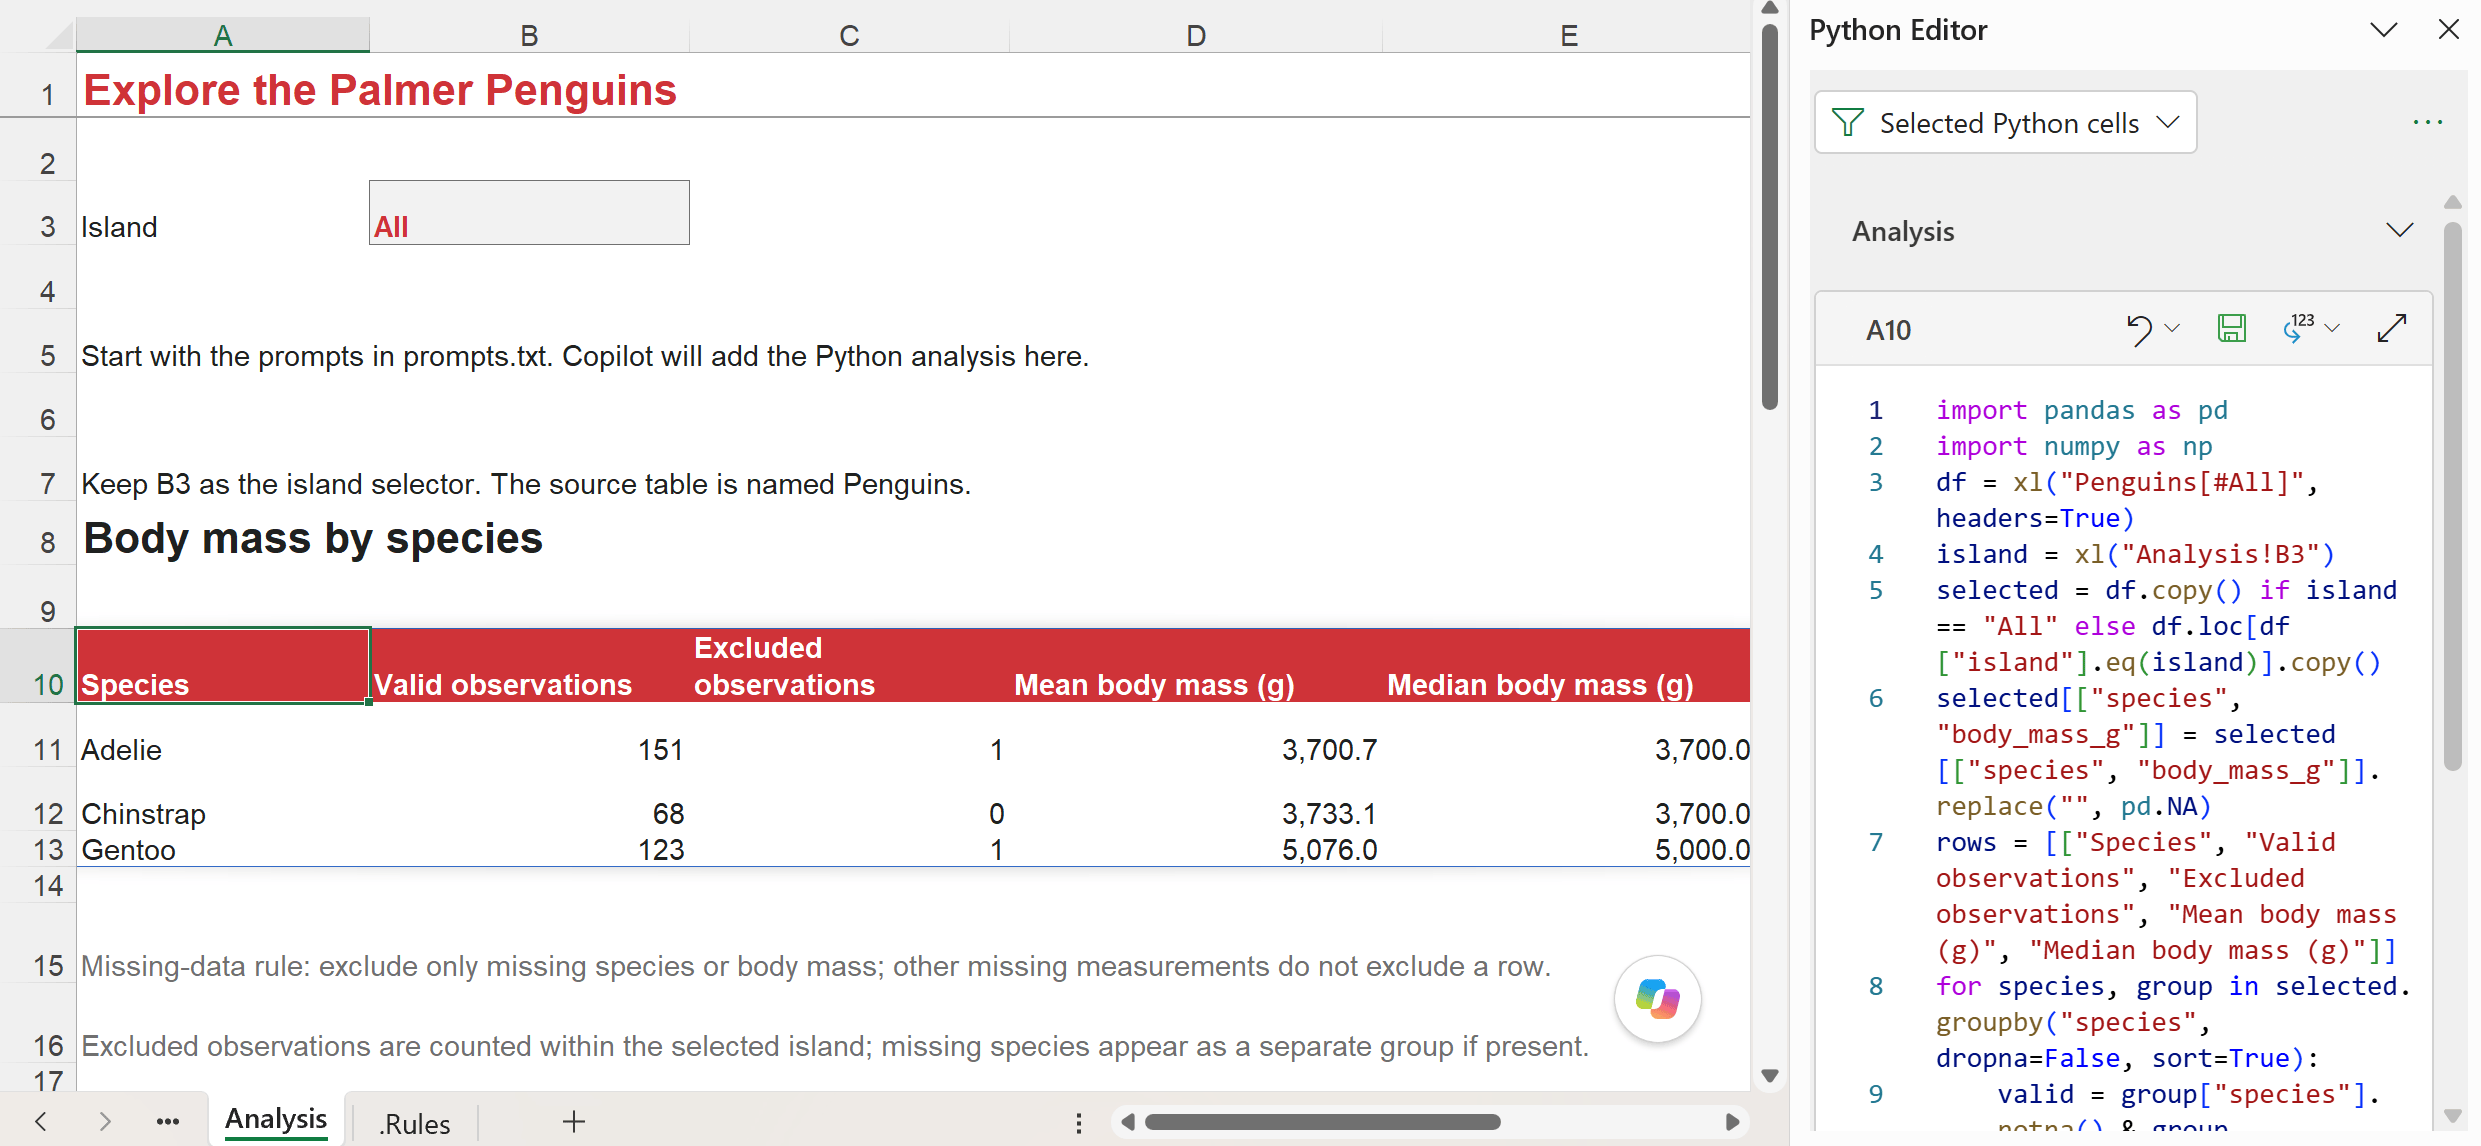
The surrounding code may differ from one run to another. What matters is that these are real references, the filtering and missing-data handling match the request, and the results agree with the data. A nicely formatted table of pasted numbers does not establish any of that.
Add a plot, then change the workbook
Next, ask for a view that makes the species differences easier to see:
@python-in-excel Add a scatterplot of flipper_length_mm against body_mass_g below the summary on Analysis. Use the current island in B3, distinguish species with labeled colors and marker shapes, and follow .Rules for units, missing values and formatting. Keep the plot backed by a Python in Excel cell that reads the workbook data. State the valid observation count. Briefly explain what changes when we compare species separately rather than pooling every penguin together. Do not claim causation.Python in Excel includes pandas, Matplotlib and seaborn among its default analytical libraries. The data are already in our workbook, so this exercise does not depend on downloading a sample dataset from inside the Python runtime.
In this run, Copilot put the plot-generating Python in A20 and placed a linked picture below it. It also added a small correlation summary. That extra output is worth reviewing, but the main requirement is that the plot reads the workbook inputs.
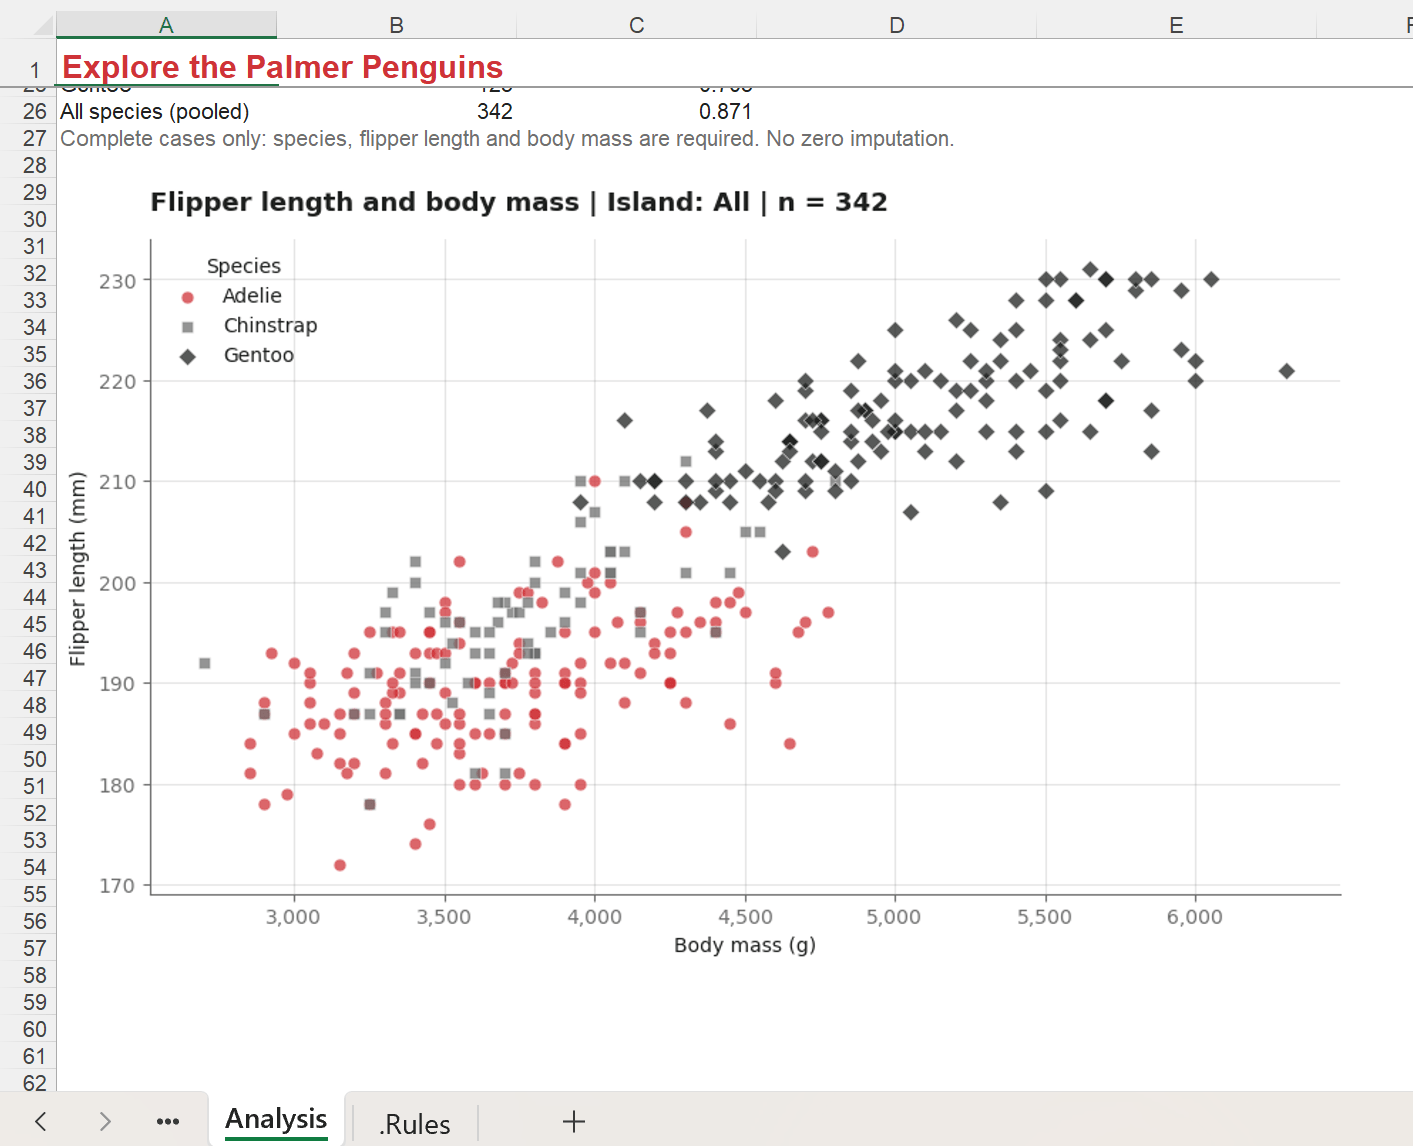
For all islands, the plot should use 342 observations. Gentoo penguins tend to be heavier and have longer flippers in these data, which is one reason to distinguish species before interpreting an overall pattern. The plot supports an exploration of associations; it does not tell us that lengthening a penguin’s flippers causes it to gain weight.
Now change Analysis!B3 from All to Dream and allow the Python formulas to calculate. This is the practical test of whether we built something that lives in the workbook.
The filtered data should contain 124 observations: 56 Adelie and 68 Chinstrap, with no Gentoo. The mean body masses should be approximately 3,688.4 g and 3,733.1 g, respectively. The plot should reflect the same island selection. If nothing changes, inspect whether the Python code actually reads B3 rather than containing the literal text "All".
That is what happened in my test: the summary recalculated to those figures, and the plot title changed to Island: Dream | n = 124 with only Adelie and Chinstrap in its legend.
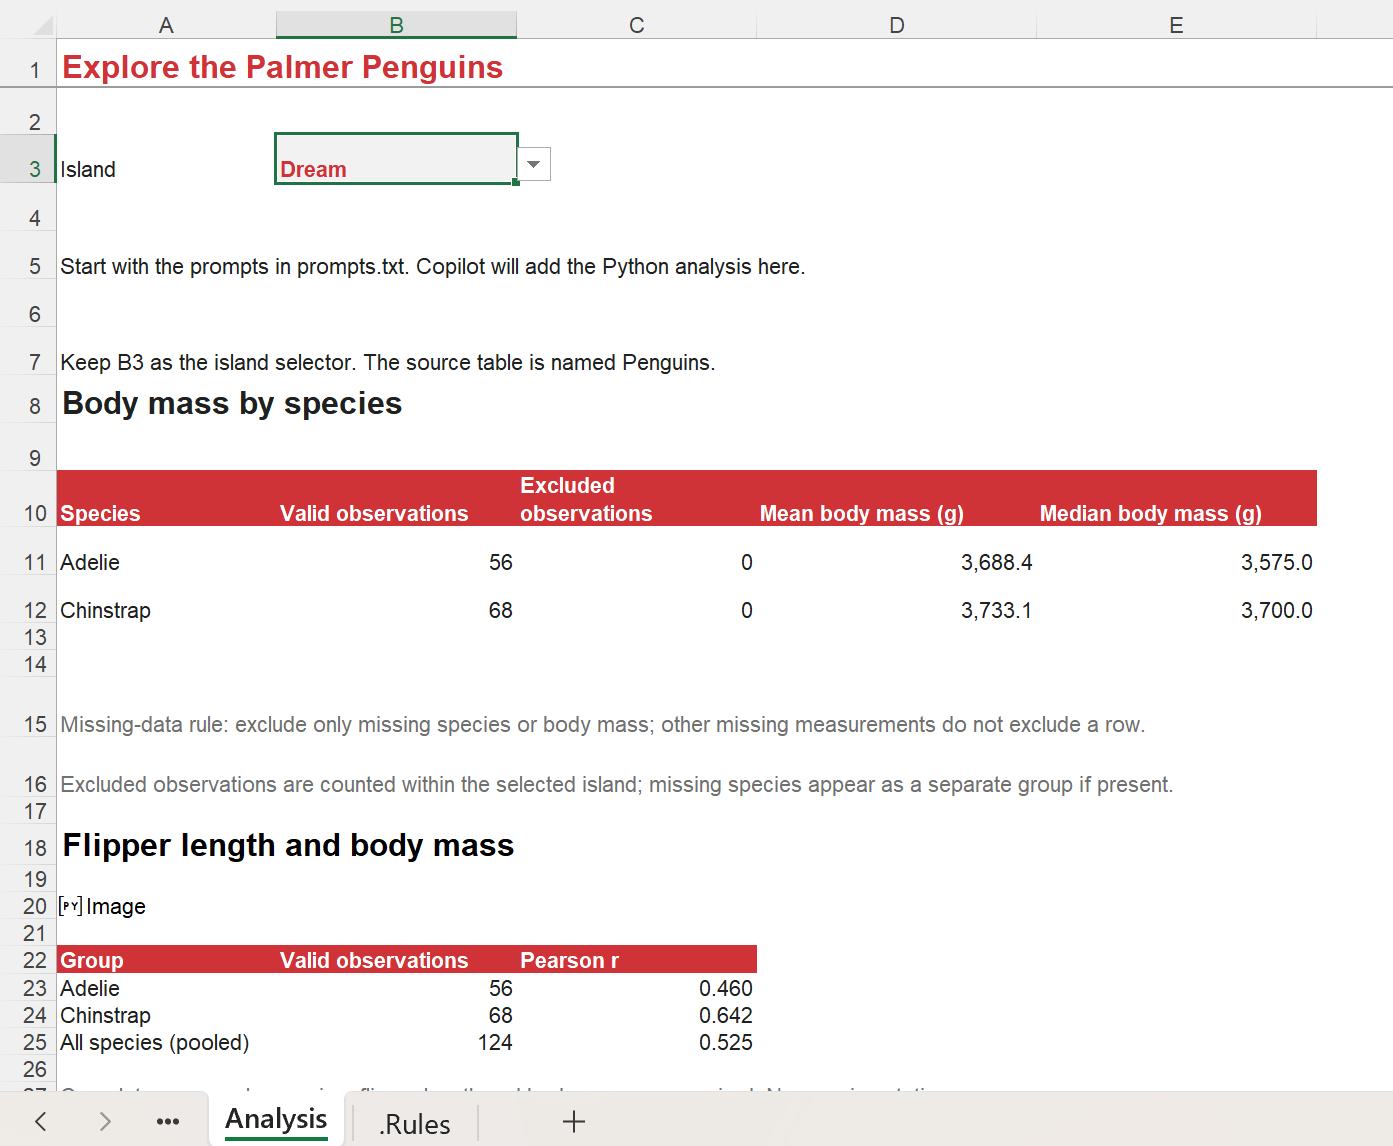
You can work with that selector without asking Copilot to rewrite the analysis each time. However, the prose already written in the chat is still a response to the earlier state. Ask for a fresh interpretation after changing the selector:
Read the recalculated Python results for Dream. Check the current row counts and species against the source table. Explain the current result and identify the Python formulas that depend on B3. Keep the existing calculations intact.This is also a useful limit to understand when we say the workbook is “interactive.” A Python-backed plot can respond to cells its code reads. That does not automatically give it Excel chart-formatting controls, point-level tooltips or slicer connections. You still need to design the interaction you want.
A quick distinction from Python scripts
My earlier custom-skill example bundled a separate .py script and brought its results back into Excel. That exercise produced a snapshot to refresh by running the skill again. Here, the Python formulas stay in the workbook: people can inspect the code, change inputs and recalculate, as we just did with the island selector.
Both approaches can run in the cloud; Python in Excel is not a local Python installation. A custom skill can also instruct Copilot to create Python in Excel cells. The useful question is what you want left behind: a returned result, or a workbook calculation that people will keep using.
Where custom skills fit next
Once you have a procedure worth repeating, you can save its instructions as your own skill. For example, a penguin-review skill could read the workbook definitions, call for Python in Excel, produce the summary and plot, and check the selector. The custom skill describes your procedure; Microsoft’s Python skill supplies specialized guidance for the Python-in-Excel part.
If skill-builder is available in your account, the download includes a prompt to help turn this accepted workflow into a custom skill. Review the resulting instructions before reusing them. They should describe how to analyze current inputs, not preserve today’s averages as constants. Microsoft’s built-in skills guide describes skill-builder, and my JSON skills example explores separating a reusable procedure from changeable report settings.
You do not need a custom skill just to run this example. The workbook rules plus Microsoft’s Python skill already give us a useful combination. Save another layer when you have a real procedure to reuse, rather than because another settings menu is available.
What I like, and what I would still watch
The strongest benefit is that the analysis can remain available to the people using the workbook. Copilot helps you get started, but the code and references are there to inspect, edit and recalculate. Python also offers a comfortable route to statistical methods and visualizations that would take more work to assemble with ordinary worksheet formulas.
The context features make that more promising. You can give the assistant your preferred explanation style, the workbook’s definitions, and a saved analytical procedure without trying to squeeze every detail into one enormous prompt. The resulting work is easier to review because the intended behavior is written down.
There are still costs. Someone needs enough Python and analytical knowledge to review the generated code. A calculation can run successfully while answering the wrong question, applying an inappropriate model or dropping the wrong rows. The missing-sex example above is a small illustration of how an innocent-looking cleanup step can change an analysis.
Python in Excel also has its own cloud environment, supported libraries and calculation requirements. It is not an unrestricted local Python installation, and a workbook with Python has different portability considerations from one built entirely with ordinary Excel formulas. Check what the next person can open, inspect and recalculate before treating it as a finished handoff.
Finally, Python does not need to win every Excel problem. A simple total, lookup or standard chart may be easier to maintain with familiar Excel tools. I would reach for this skill when Python improves the analysis or its maintainability, then make sure the people receiving the workbook can work with what it produces.
A second chance for a very promising idea
I still think the combination that got me excited about Advanced Analysis has a great deal to offer. Excel gives people a familiar working surface, Python broadens the analytical possibilities, and Copilot helps translate questions into code. Having that capability alongside workbook instructions, personalization and reusable skills gives us a better opportunity to make it fit the work people actually do.
Start with the Penguins workbook, inspect one Python cell, and change the island selector. Those few actions tell you much more about the value of this feature than a beautiful answer in a chat window.
If your team would benefit from practical training on Copilot, Python in Excel and how to review the results, bring me in to help. I build training around useful workflows and the judgment people need to maintain them.
And please take advantage of my LinkedIn Learning course, Excel with Copilot: AI-Driven Data Analysis. The full course is free, and no account is required. If you have been meaning to get started, I have made the enrollment paperwork admirably short.