If you have ever handed somebody a workbook with the words "please only change the yellow cells," you already understand one reason to try Copilot Code. Sometimes you want a colleague to have a small, focused tool: choose a department, change a threshold, see the exceptions. You know the business rules. You would just rather not spend the afternoon building the interface.
For this walkthrough, I used Microsoft Copilot's Code tab to turn eight rows of fictional budget and actual expenses into a browser-based review tool. You can try the same prompts below. The interesting part is checking whether the tool follows your rules, especially when two percentages look identical after rounding. Excel people have been preparing for this moment for years.
Product snapshot: November 5, 2026. This walkthrough uses the web version of Microsoft Copilot Code with a work account. Code is a Frontier preview; access, controls, and file delivery can change. Screenshots show the actual session, and generated layouts may differ.
First, get into the right Copilot
Open Microsoft Copilot, sign in, and choose Code beside Chat and Cowork. In my account, the starting screen offered New session, a Create anything box, and an Auto model setting. I left the model on Auto. This is separate from the Copilot pane inside Excel and from GitHub Copilot.

If the Code tab is missing, start with access rather than hunting for a clever prompt. Microsoft lists a work-account Copilot license and organizational enablement among the requirements. The expandable note below is the short version to take to IT.
What licensing and provisioning should I check?
For a work account, confirm the required Microsoft Copilot license, Frontier access, and Code enablement. Also confirm that usage-based billing covers Code and the intended users, with a spending policy and appropriate limits. Having Copilot in Excel does not, by itself, establish that all of this is ready.
Microsoft's Copilot Credits licensing guide describes the license and credits prerequisites. Start with the Code admin guide for organizational controls. For a desktop rollout, the current setup guidance also covers the unified Copilot app and Windows Beta update channel.
Personal accounts need a supported consumer plan. I tested a work account here, so this article is not a test of consumer-plan eligibility or a promise of unlimited included usage.
1. Give it a small job with rules you can check
Our job is an expense review, with Actual minus Budget as the variance. Positive means unfavorable. A budgeted row is flagged only if it is at least $5,000 over budget and at least 10% over budget. Unbudgeted spending gets its own status. That last detail matters: dividing by zero is not a budgeting philosophy.
The first prompt includes all eight rows, so you can paste it without uploading anything. The download contains the same CSV for opening in Excel, all the prompts, and a short README. You do not need a GitHub account, a terminal, or a Git clone to follow along.
Help me plan a small budget-versus-actuals review app for an FP&A analyst. Do not build it yet.

Use only this fictional expense data. All amounts are USD and every row is an expense:
Period,Department,Account,Budget,Actual
2026-10,Operations,Freight,50000,56000
2026-10,Operations,Temporary staff,50000,55000
2026-10,Operations,Supplies,50000,54999
2026-10,Finance,Audit,100000,106000
2026-10,Finance,Software,20000,18000
2026-10,Sales,Travel,0,2000
2026-10,Sales,Events,10000,10000
2026-10,Finance,Training,0,0

The app should calculate Actual minus Budget. Positive variance is unfavorable. For positive budgets, variance percent is variance divided by Budget. Flag an expense only when unfavorable variance is at least $5,000 AND at least 10%, using unrounded values. Show zero-budget rows with positive actuals separately as Unbudgeted; their percentage is N/A. Zero budget and zero actual is No spend, also N/A.

I want totals, a department filter, adjustable dollar and percentage thresholds, a clear review table, and a CSV export of the filtered rows including the calculated columns and review status. Totals should follow the department filter, but changing thresholds must not change the underlying Budget or Actual amounts.

Keep this a self-contained practice app with no external services, work-file connections, sign-in, or publishing. Restate the rules, propose the smallest useful layout, and tell me any assumptions before building.
Read the response before asking it to build. In my run, Code correctly separated the zero-budget rows, calculated the control totals, and asked about hosting. I chose Standalone, never published and accepted the assumptions after checking them: thresholds apply to individual rows, the department filter controls totals and exports, and unbudgeted rows remain part of the totals.
That is a useful extension of the distinction I made in beginner, intermediate, and advanced Copilot. More advanced use includes defining the business rules and deciding whether the answer makes sense. The vocabulary in the prompt is almost entirely finance vocabulary.
2. Build it, then get the actual file
Once the plan matches what you mean, send the next prompt in the same session. We are asking for a single HTML file: a small web page with its data and logic included. Opening that file in a browser runs the tool; you are not signing up to maintain a web server.
Build the agreed standalone app now as a single HTML file I can download and open in a browser. Embed the eight sample rows and all code in the file; use no external services or libraries. Keep the business rules unchanged. Use a white background, readable text, clear labels, and a red accent for unfavorable items. Include text statuses as well as color. Show variance percentages to three decimal places so Supplies does not look identical to Temporary staff. Give me a download link when it is ready.
My first build had the calculations, department filter, adjustable thresholds, separate zero-budget table, and CSV export. It also surfaced a preview-product wrinkle: the reply said the file was ready, but there was no usable download in the Workspace pane. A follow-up produced a OneDrive link, which then stalled at sign-in in my browser. I retrieved the unchanged HTML through a code block instead. Here is the recovery prompt if file delivery gets in your way too.
If you cannot get the generated HTML file
Ask Code to return the full file rather than a description of where it should be. This is the fallback I used:
The OneDrive download is stuck at a sign-in redirect in my browser. Please paste the complete, unchanged bva-review.html source in one HTML code block so I can copy it into a local .html file. Do not omit any lines or use placeholders. Do not rebuild, upload, or change the app.
Use the code block's Copy code button, paste into Notepad, and choose Save As. Set the file type to All files, use UTF-8, and name it bva-review.html, not bva-review.html.txt. Open that file in your browser. You are saving the generated file, not being asked to write its code.
3. Check the awkward rows before admiring the layout
A respectable-looking table is a very persuasive thing. Give it five minutes with a familiar font and it practically has a job title. Check the numbers anyway. With all departments selected and the thresholds at $5,000 and 10%, the totals should be $280,000 budget, $301,999 actual, and $21,999 unfavorable variance.
Before opening the answer below, look at Audit and Temporary staff. Audit is $6,000 over budget; Temporary staff is $5,000 over. Which one should be flagged?
Reveal the answer: which expense should be flagged?
Temporary staff should be flagged; Audit should not. Temporary staff reaches both boundaries: $5,000 and 10%. Audit passes the dollar test but is only 6% over budget. The rule uses AND, so both tests must pass.
Supplies adds a second trap. Its $4,999 variance is 9.998%, which can display as 10.00% after rounding. It still fails the actual thresholds. Decide from the underlying values, not the formatted display.
| Account | Variance | Variance % | Expected result |
|---|---|---|---|
| Freight | $6,000 | 12.000% | Flagged |
| Temporary staff | $5,000 | 10.000% | Flagged |
| Supplies | $4,999 | 9.998% | Below threshold |
| Audit | $6,000 | 6.000% | Below threshold |
| Software | -$2,000 | -10.000% | Favorable |
| Travel | $2,000 | N/A | Unbudgeted |
| Events | $0 | 0.000% | On budget |
| Training | $0 | N/A | No spend |
Open the starting CSV in Excel for an independent check. With Budget in D and Actual in E, use =E2-D2 for the variance and =IF(D2=0,"N/A",(E2-D2)/D2) for the percentage. Format the numeric results as percentages. This is where knowing a little Excel pays off much more than knowing the name of a JavaScript framework.
Next, change the dollar threshold to $7,500 and leave the percentage at 10. No budgeted row should remain flagged. Travel should still be Unbudgeted, and the budget and actual totals should stay put. Then reset the thresholds, choose Operations, and export the CSV. You should get three rows, $150,000 budget, $165,999 actual, and $15,999 variance.
Both the original and revised files passed independent calculation checks for all eight statuses, both zero-budget cases, the changed threshold, and the Operations totals and CSV values. The browser controls and visual layout still need a click-through in your own copy; calculation checks alone do not establish that the whole interface works.
This is the same Learn, Confirm, Extend approach I use in training. Understand the calculation, confirm it with cases you can evaluate, then extend what you can do with it.
4. Ask for one useful improvement
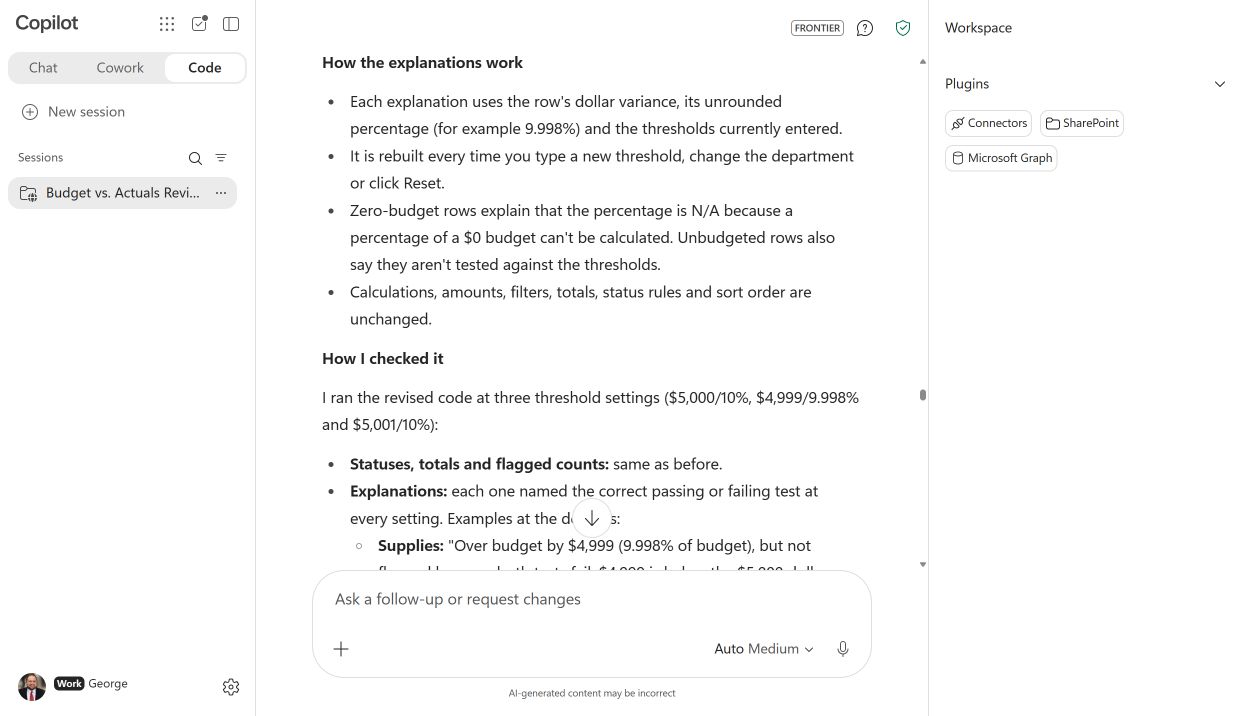
The next change is something a colleague might actually request: "Why did this row get that label?" Ask for an explanation that follows the current rules. This gives us a more useful review tool while keeping the source figures and calculations fixed.
Add a column called "Why this status" to both tables and the CSV export. Explain each row's result in plain English using its actual dollar variance, unrounded percentage, and the current thresholds. For zero-budget rows, explain why the percentage is N/A. Update the explanation when I change a threshold. Keep every calculation, source amount, filter, and existing status rule unchanged. Give me the revised standalone HTML file. Also return the complete revised HTML in one code block so I can save it locally if the download link fails.
Open the revised file and repeat the checks. At the original thresholds, the Audit explanation should identify the percentage test it fails. At $7,500, Freight should explain that $6,000 falls short of the dollar threshold. The explanation for Travel should point to its zero budget, not invent a percentage.
There is a connection here to my earlier work on using JSON to structure Copilot outputs: precise rules and a defined output shape make the result easier to inspect. You do not need to learn JSON for this exercise, but you are already making the same kinds of decisions.
What about a CLI, slash commands, MCP, and GitHub?
They are reasonable questions, especially if you have seen people using Claude Code or GitHub Copilot. Keep the product names attached to the features. For this exercise, the useful starting point was a plain-language brief, a file, and checks I understood.
A short translation for Excel users
CLI and slash commands: GitHub Copilot has a documented command-line tool and commands such as /help. That is a separate product surface. I did not find a standalone Microsoft Copilot Code CLI or a general slash-command catalog in the current Code documentation, so I would not copy terminal instructions into this Code tab and expect them to work. See the GitHub Copilot CLI guide for that product.
MCP and plugins: MCP is a way for an AI tool to use outside tools and data. Code supports connected capabilities under permissions and organizational policy; availability depends on the service and setup. You do not need an MCP server for these eight rows. Microsoft's Code usage guide and plugin guidance explain the supported connections.
GitHub: It can store the project's files and change history and support review through pull requests. Microsoft documents repository connections, branches, commits, and draft pull requests, subject to admin enablement. Some repository workflows are local-only. It is optional for getting started; see Microsoft's GitHub integration guide.
The other practical boundary is Excel itself. This practice app contains a snapshot of the sample rows; changing a workbook will not automatically refresh it. If your real problem is combining monthly exports into the same repeatable report, my Copilot and Power Query walkthrough may be the more direct next step. A new interface is useful when it serves the work.
Bring a finance problem to your next training session
If your team can explain the rules behind a workbook but wants help turning them into a useful tool, that is the starting point for my Copilot Code training for finance teams. We can work through a scoped variance explorer, scenario calculator, or close tracker, with time to check what Copilot produces and refine it together.
Which spreadsheet deserves a simpler front end?
Bring one recurring finance task, the people who use it, and the rules a correct result must follow. We can scope a hands-on Copilot Code workshop around that starting point and your team's current access.
For today, try the first prompt and see whether Code states your review rules correctly before you ask it to build. A small app with rules you can check is a useful place to start.
If you would rather strengthen the Excel Copilot basics first, my full LinkedIn Learning course, Excel with Copilot: AI-Driven Data Analysis, is free and no account is required.