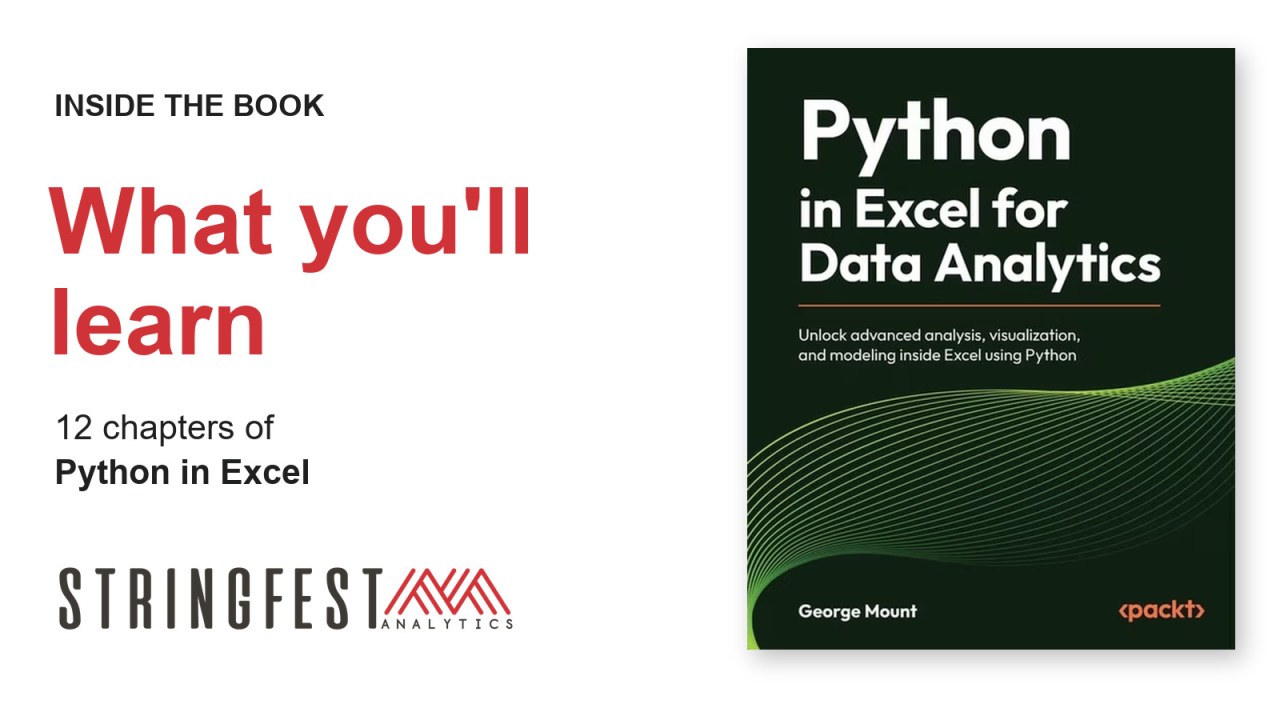
Learning Python gets more interesting when you can connect it to a workbook you actually need to finish. Maybe you want to investigate an odd result, build a forecast you can explain, or make sense of a column full of customer comments. My book, Python in Excel for Data Analytics, builds toward those kinds of tasks using the spreadsheet skills you already have.
As I did for Modern Data Analytics in Excel, I'd like to give you a chapter-by-chapter look at what you'll learn. Here's how the twelve chapters fit together, from your first Python cell to analysis you can check, explain, and share.
Find your chapter
CHAPTERS 01–04
Start with the data
CHAPTERS 05–08
Build and test models
CHAPTERS 09–12
Extend your workflow
Chapter 1: Getting Started with Python in Excel
You'll insert and run your first Python cells, work with Python objects, and get acquainted with the built-in environment. We'll also look at why the order of Python cells matters and where this environment has limits. Python has moved into the workbook, and it comes with a few house rules.
Chapter 2: Exploring and Analyzing Data with Pandas
If you work with filters, calculated columns, and PivotTables, you already have useful reference points for pandas. You'll load Excel tables into DataFrames, check their contents, filter and sort rows, create columns, and summarize groups. You'll also learn when to keep a result as a Python object and when to return it to the grid as Excel values.
Chapter 3: Visualizing Data with Seaborn
This chapter expands your charting options with histograms, box plots, scatterplots, correlation heatmaps, and small multiples. You'll use seaborn to build the charts and Matplotlib to refine their labels and layout. Along the way, you'll practice choosing a chart that fits the question and displaying it clearly inside Excel.
Chapter 4: Performing Exploratory Data Analysis
Now the data work and charting come together. You'll assess data quality, handle missing values, create useful categories and calculations, and compare groups with tables and plots. When something unusual appears, you'll investigate it. An outlier gets a closer look before it gets an eviction notice.
Chapter 5: Running Statistical Tests
A difference on a chart raises a question about how much weight to put on it. You'll explore that question with t-tests, ANOVA, chi-square tests, and bootstrapping. The emphasis is on interpreting p-values alongside effect sizes and confidence intervals, so you can discuss both the size of a result and the uncertainty around it.
Chapter 6: Building Regression Models
Working with the Palmer Penguins dataset, you'll use linear regression to predict measurements and logistic regression to classify species. You'll learn to read model output, make predictions, and evaluate performance with held-out data and visual checks. A model needs to do useful work on observations it hasn't already seen.
Chapter 7: Forecasting Time Series Data
You'll resample time-based data, examine trend and seasonality, and build a Holt-Winters forecast. Then you'll test its accuracy against held-out observations and a simple baseline. If you've read my run-rate analysis walkthrough, you'll recognize the habit: check how an approach performs before trusting the number it produces.
Chapter 8: Running Simulations and Scenario Models
Using an inventory decision as the example, you'll simulate uncertain demand and examine the resulting range of profits. You'll compare stocking decisions using typical outcomes, downside risk, and the probability of a loss under the model's assumptions. This gives your familiar what-if analysis room to explore thousands of possibilities.
Chapter 9: Extracting Insights from Text Data
Customer comments need a different approach from a column of sales figures. You'll prepare review text, score sentiment with VADER, find common and distinctive terms, and compare patterns across product categories. Checking those scores against star ratings helps you spot disagreements that deserve a human reading.
Chapter 10: Integrating Python with Native Excel Features
You'll bring external data into Python through Power Query and connect Python calculations to Excel dropdowns, named ranges, and charts. The result is a workbook where someone can change the view without editing your code. This puts the division of labor from my Power Query and Python comparison into practice.
Chapter 11: Accelerating Analysis with AI Assistance
Here you'll practice describing an analytical task clearly, getting help with the Python, and checking what comes back. You'll review examples where working code quietly drops observations or treats categories as numbers. The skills from earlier chapters give you a basis for catching those choices and deciding whether the analysis is fit to use.
Chapter 12: Continuing Your Python in Excel Journey
The final chapter helps you choose where to go next. You'll explore additional libraries, notebooks and local Python environments, and habits such as version control and reading documentation. We'll also consider how Microsoft's wider automation tools fit around your analysis, giving you options to investigate as your projects grow.
Find your next analytical step
Each chapter adds to the same working toolkit, so a data check you learn early on can help you evaluate a forecast or question an AI-generated model later. If that sounds like the direction you'd like to take your Excel skills, take a closer look at Python in Excel for Data Analytics.