Once you’ve been working in a Python in Excel workbook for a while, it’s easy to lose track of what you’ve already created: was the DataFrame called sales or sales_df? Did the tax rate come in as a number or a one-cell DataFrame? Is that region list still there?
In something like VS Code or Spyder, you’d normally have an environment pane off to the side showing you the objects you’ve created, their types, and some basic information about them.
Python in Excel doesn’t really give you that. You can see the cells that created your Python objects, but that’s not the same thing as having a clean inventory of what’s currently sitting in the Python environment.
So in this post, I want to explore some ways to answer the following:
- What variables have I created?
- What kind of object is each one?
- What does each one contain?
If some of those terms are new, don’t worry too much about them yet. A variable is basically a name you’ve assigned to something in Python. The thing attached to that name is an object, and objects can come in different types, such as a number, list, or pandas DataFrame.
If you want a little more background on those different types before continuing, I have a separate walkthrough here: Python in Excel: How to understand data types. Microsoft’s Python in Excel DataFrames documentation is also a useful reference for the DataFrame in particular.
We’ll start with a few basic tools for inspecting one object at a time, then build a small environment table that answers all three questions at once.
To follow along, download the exercise file below:
The companion workbook has two Excel tables, Sales and Forecast, and two named ranges, TaxRate and RegionList, on the Data sheet.
The first Python cell on the Tutorial sheet loads them into four variables:
sales = xl("Sales[#All]", headers=True)
forecast = xl("Forecast[#All]", headers=True)
tax_rate = xl("TaxRate")
regions = xl("RegionList").squeeze(axis=1).tolist()
"Variables loaded"
That last line is just a throwaway string so the cell gives me something visible to confirm that it ran.
Inspecting one variable at a time
Before looking at the whole environment, we’ll start with one object: the sales DataFrame.
There are really three questions: what is it, how big is it, and what’s in it?
For the type:
type(sales)

For the dimensions:
sales.shape

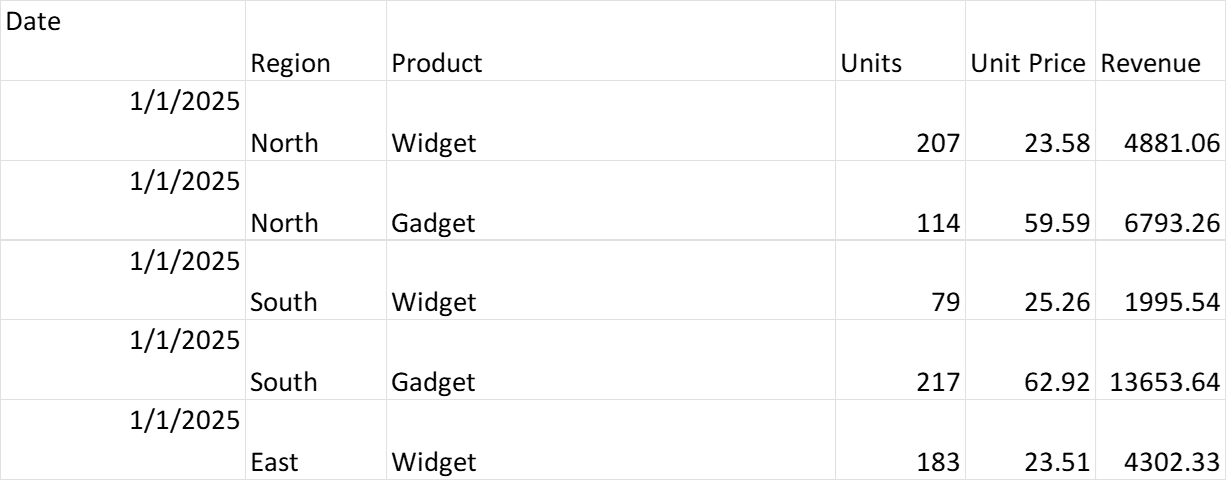
And for a quick look at the contents:
sales.head()
&nsbp;
These are all useful little one-liners for exploring the data you have in front of you, and you’ll use them constantly. Python, and pandas in particular, has plenty more of these handy inspection tools. But what if you don’t remember what variables you’ve created in the first place, or you just want a bigger-picture view of everything that’s currently available?
Listing the names that exist
Python in Excel gives you a couple of quick ways to see what variables are currently around.
One option is %who:
%who
Or, for a little more detail:
%whos
The % may look strange if you’re new to Python. These are IPython magic commands, which are extra commands added on top of regular Python for working interactively. A single % indicates a line magic, while %% is used for commands that apply to an entire cell.
In Python in Excel, %who lists the variables currently defined, while %whos gives you a more detailed summary, including things like the variable name, type, and a preview of the contents.
The catch is that their output is printed to the Python Editor console, rather than returned as something you can work with directly in the worksheet.
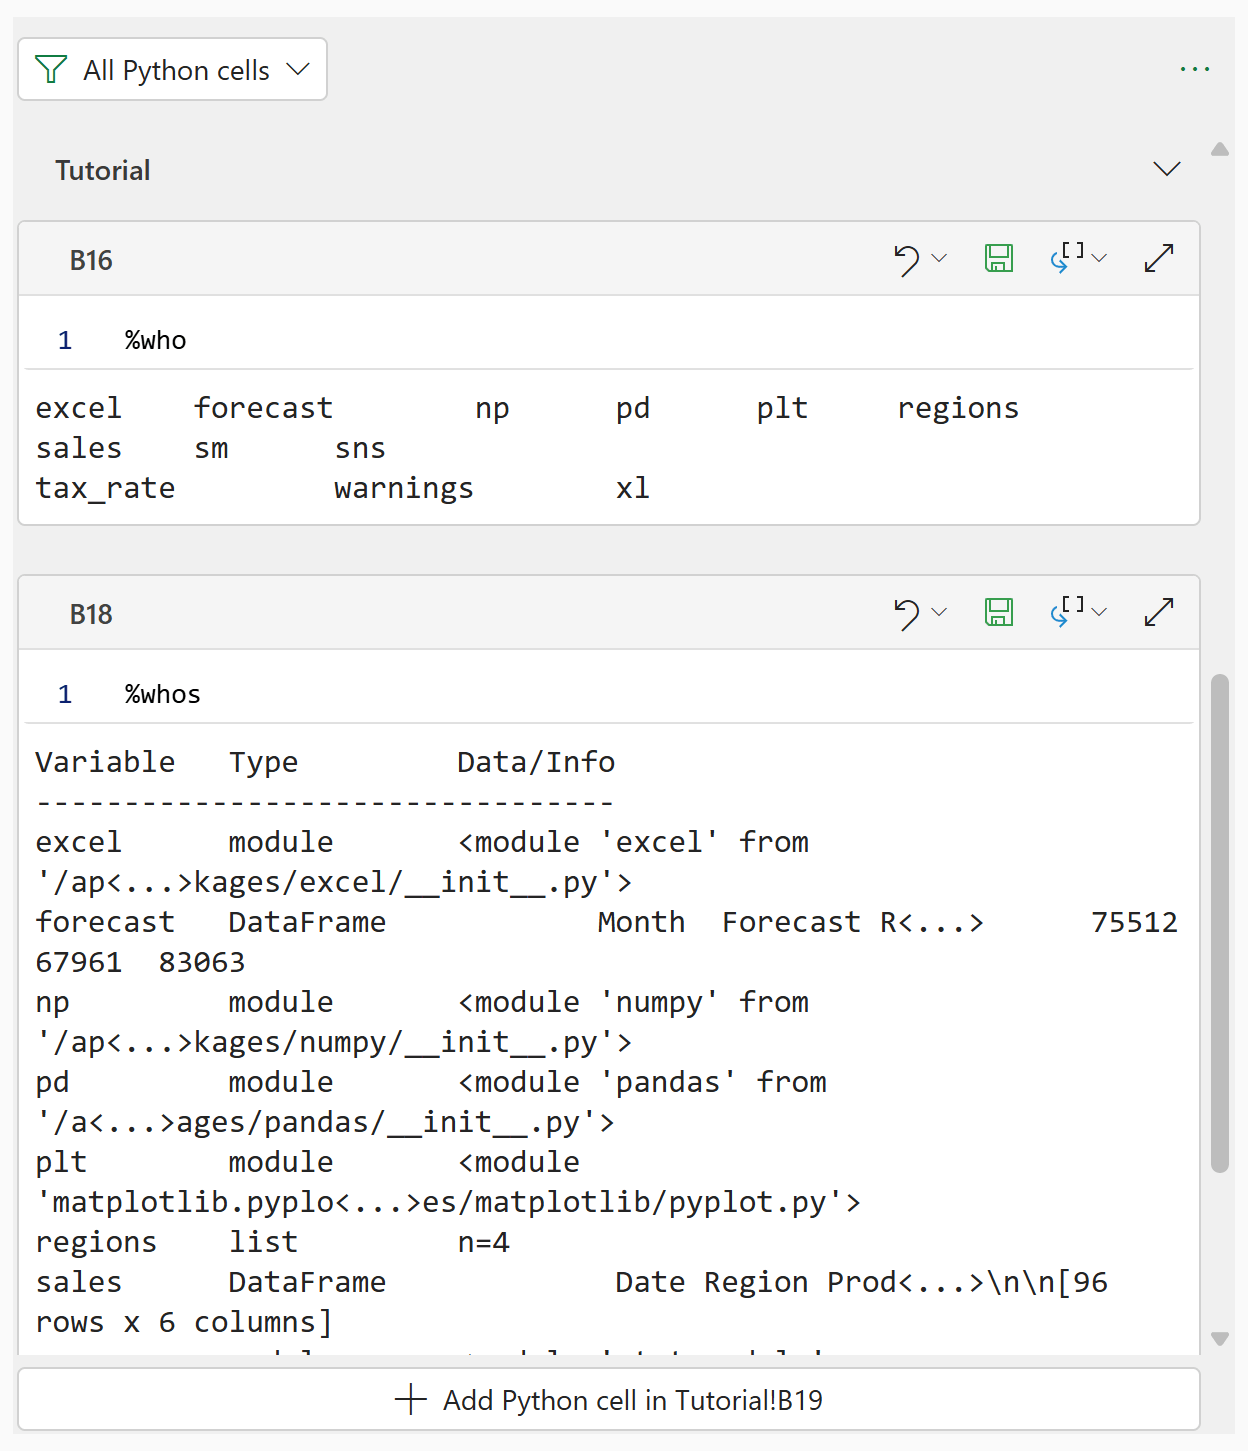
For a quick check, %who and %whos work fine. But if you want something you can actually filter and build on, dir() is more useful. This will give you a list of the names Python currently knows about. From there, you can clean up that list and narrow it down to the variables you actually care about.
For example, I’ll just look at the first ten:
dir()[:10]

Because dir() returns a list, we can do something with it. For example, many of the names you’ll see begin with underscores and belong to Python’s internal workings, so we can filter those out:
[name for name in dir() if not name.startswith("_")]

That gets us closer, although you’ll still see things like pd, np, and xl mixed in with variables such as sales and forecast.
So %who and %whos are handy for a quick look in the Python Editor. dir() is more useful when you want the names back as data you can filter or build on.
But dir() still only gives us the names. If we want to know what objects those names actually point to, that’s where globals() comes in.
Building a variable inventory
globals() gives you a dictionary where the keys are names in the environment and the values are the Python objects behind them.
That means we can loop through it, pull out the information we care about, and, since we’re in Excel, put the results into a table:
pd.DataFrame([
    {
        "Variable": name,
        "Type": type(value).__name__,
        "Preview": repr(value)[:100]
    }
    for name, value in globals().items()
    if not name.startswith("_")
    and not callable(value)
    and type(value).__name__ != "module"
])
Set the Python cell’s output to Excel Value and the result spills onto the grid:

And that’s basically the environment table I was looking for.
It gives you the variable name, the object type, and enough of a preview to usually recognize what you’re looking at.
A few pieces of the code are worth understanding:
type(value).__name__ turns something ugly like:
<class 'pandas.core.frame.DataFrame'>
into simply:
DataFrame
repr(value)[:100] takes Python’s text representation of the object and keeps the first 100 characters. For a short list, you may see the whole thing. For a DataFrame, you’ll usually see enough of the column names and first few values to recognize it.
Then the conditions at the bottom do the cleanup:
if not name.startswith("_")
and not callable(value)
and type(value).__name__ != "module"
That filters out Python’s underscore-prefixed names, functions like xl(), and modules. What’s left is much closer to the stuff you actually created and care about.
Bonus: which packages have I imported?
Python gets much of its usefulness from reusable collections of code that other people have already written.
You’ll often hear terms like library, package, and module used around this idea. There are technical distinctions between them, but as a beginner you don’t need to get buried in Python packaging terminology.
For what we’re doing here, think of a package or library as a collection of ready-made Python tools. pandas, for example, gives us tools for working with tabular data, including the DataFrame we’ve been using throughout this post.
When some of that code is loaded into your current Python environment, you’ll see a module there. Names like pd and np are short aliases used to refer to pandas and NumPy.
Python in Excel actually loads several major libraries for you automatically. Microsoft lists pandas, NumPy, Matplotlib, seaborn, and statsmodels among the libraries imported by default. Python in Excel also includes a much larger collection of open-source libraries provided through Anaconda. Microsoft’s Open-source libraries and Python in Excel page is the place to go if you want to explore that larger environment.
Since we filtered modules out of our variable table, we can take a quick look at what we removed:
[
    name
    for name, value in globals().items()
    if type(value).__name__ == "module"
]
You’ll see familiar names such as:

Again, these are modules currently loaded into this Python environment. That’s different from asking which packages are installed and available for you to use. The available package list is much bigger.
If you’re curious about some of the things Python in Excel loads automatically and why they’re there, I’ve also written about the Python in Excel initialization environment and how that initialization environment can be edited.
That’s probably enough package talk for one post.
Conclusion & takeaways
For one object, type(), shape, and head() will tell you most of what you need.
For the bigger question of “what have I created in this workbook?”, globals() gives you the raw material, and a small filter turns it into a pretty useful inventory table.
Once you have that sitting somewhere in the workbook, you can stop guessing whether you called the thing sales, sales_df, sales_data, or whatever other name seemed like a good idea twenty minutes ago.
If you’d like the full treatment, my next book, Python in Excel for Data Analytics, comes out January 8, 2027 from Packt. It starts with the same basic idea as this post, getting data from the Excel grid into Python and understanding what you’ve created, then works up through visualization, statistical analysis, forecasting, and simulation without leaving Excel.
Pre-orders are open now: