Excel analysts can spend a surprising amount of time teaching Excel how their company’s calendar works.
The calendar says the year starts in January. Your company might say it starts in July. A week is seven days, but your reporting process may care very specifically about which day that week starts. Then there are month-end cutoffs, fiscal quarters, reporting periods, and all the other little rules that eventually determine where a transaction belongs.
You can handle a lot of this with regular Excel formulas, and Power Query handles quite a bit more. If all you need is a Monday-start week column or a month-end anchor, Power Query already gives you Date.StartOfWeek and Date.EndOfMonth, and I would use them.
Where Python in Excel starts to get more interesting to me is when several calendar rules start piling up, especially when some of them are irregular enough that you need more explicit logic. It also gives you a good way to test whether the calendar is actually behaving the way you think it is.
Let’s use a simple sales table and build out a few common calendar fields in Python in Excel. You can follow along with the exercise file below:
Start with the transaction data
The source data is deliberately simple: transaction ID, date, and amount.
I included a few dates around important reporting boundaries, especially June 30 and July 1. Those two rows will matter in a minute because they fall on opposite sides of our fiscal year-end. We also have a few dates later in July so we can see how the same logic behaves within a reporting period.
Let’s bring the Excel table into pandas first:
import pandas as pd

sales = xl("sales_data[#All]", headers=True)

sales["date"] = pd.to_datetime(sales["date"])
sales["amount"] = pd.to_numeric(sales["amount"])

sales = sales.sort_values("date").reset_index(drop=True)

sales.head()
Nothing too exciting yet. We are bringing the Excel table into pandas and making sure the columns have the data types we need. pd.to_datetime() gives us a proper pandas date column, which will let us use the date and period tools coming up. pd.to_numeric() does the same basic cleanup for the amount column.

I also sort the rows by date so we can read the transactions in chronological order. After sorting, reset_index(drop=True) rebuilds the row index from 0, 1, 2, and so on instead of keeping the original row positions.
The two rows to keep an eye on are T002 on June 30 and T003 on July 1. They are only one day apart, but once we apply a June fiscal year-end, they will belong to two different fiscal years.
Now we can start adding the reporting rules.
Set up a June fiscal year-end
Suppose the company uses a June 30 fiscal year-end.
That means July 1, 2025 is already part of fiscal 2026. The calendar still says 2025, of course, but for reporting purposes we have crossed into a new year.
Pandas has a convenient way to represent this with quarterly periods:
fiscal_year_end = "JUN"

fiscal = sales["date"].dt.to_period(f"Q-{fiscal_year_end}")

sales["fiscal_year"] = fiscal.dt.qyear.astype(int)
sales["fiscal_quarter"] = fiscal.dt.quarter.astype(int)

sales["fiscal_period"] = (
    "FY" + sales["fiscal_year"].astype(str)
    + " Q" + sales["fiscal_quarter"].astype(str)
)

sales[
    ["date", "fiscal_year", "fiscal_quarter", "fiscal_period"]
].head(10)
Q-JUN tells pandas that the fiscal year ends in June. From there, July through September becomes Q1, October through December Q2, January through March Q3, and April through June Q4.

You can see the important boundary right in the output. June 30, 2025 is FY2025 Q4. Move ahead one day to July 1 and we are in FY2026 Q1. That is exactly the kind of transition I wanted this sample data to make easy to spot.
I also like that the main business assumption is sitting right at the top:
fiscal_year_end = "JUN"If the company changes its year-end, or you reuse this for another organization, that rule is easy to find and change.
The qyear part is worth calling out too. It gives us the year the fiscal period ends in, which is why July 2025 is labeled fiscal 2026 rather than fiscal 2025.
You could absolutely build these fields with Excel formulas. Where pandas starts to get more useful is when this fiscal-year rule is only one piece of a larger calendar setup and you want all of that logic together.
One small Python in Excel detail: fiscal contains pandas Period objects. Those are useful inside Python, but they are not something I would send directly back to the worksheet. Here I pull out the fiscal year and quarter as regular integers and build fiscal_period as plain text instead.
Add a custom business week
Now let’s say the reporting week starts on Monday. Pandas numbers Monday as 0 and Sunday as 6, so we can make that rule explicit:
week_start_day = 0

days_since_week_start = (
    sales["date"].dt.weekday - week_start_day
) % 7

sales["week_start"] = (
    sales["date"]
    - pd.to_timedelta(days_since_week_start, unit="D")
)

sales["week_end"] = (
    sales["week_start"]
    + pd.Timedelta(days=6)
)

sales[
    ["date", "week_start", "week_end"]
].head(10)
The basic idea is to figure out how many days have passed since Monday, then subtract that amount from each transaction date. Once we have the Monday starting the week, the Sunday ending it is just six days later.

There is an interesting overlap in our sample data here. June 30, 2025 is a Monday, so its reporting week runs from June 30 through July 6. July 1 therefore belongs to that same business week, even though we just saw that it belongs to a different fiscal year.
That is a good example of why these calendar fields are useful. The same transaction can belong to FY2026 while also belonging to a reporting week that began in June. Neither is wrong. They are answering different reporting questions.
And again, the rule itself is easy to find:
week_start_day = 0If the business uses Sunday or Saturday instead, change that setting and the rest of the calculation follows from it.
Add month-start and month-end dates
Month boundaries come up all the time in reporting.
Sometimes you want every transaction tied to the first day of its month. Other times month-end is the more useful anchor, especially for snapshots, budgets, accruals, or period reporting.
We can create both from the same date column:
month_start = (
    sales["date"]
    .dt.to_period("M")
    .dt.to_timestamp()
)

sales["month_start"] = month_start

sales["month_end"] = (
    month_start
    + pd.offsets.MonthEnd(0)
)

sales[
    ["date", "month_start", "month_end"]
].head(10)
Here I first convert each transaction date into a monthly period, then back into a timestamp. That gives us the first day of the month. From there, MonthEnd(0) moves us to the corresponding month-end date.

You can see how the dates collapse into common reporting buckets. June transactions all point back to June 1 and forward to June 30. July transactions point to July 1 and July 31, regardless of where they fall within the month.
This is also where the different calendar fields start to complement each other. A July 1 transaction can now be identified as FY2026 Q1, part of the business week beginning June 30, and part of the July reporting month.
At this point, fiscal year, fiscal quarter, business week, month start, and month end are all being derived from the same source date column. That is really the appeal for me: the company’s calendar logic stays together in one place and can keep growing as the reporting requirements do.
Bring the calendar fields together
Now let’s pull all of these calendar fields into one view:
calendar_view = sales[
    [
        "transaction_id",
        "date",
        "amount",
        "fiscal_year",
        "fiscal_quarter",
        "fiscal_period",
        "week_start",
        "week_end",
        "month_start",
        "month_end"
    ]
]

calendar_view
This is where I think the example starts to come together. Each transaction now has several different reporting labels attached to the same date.
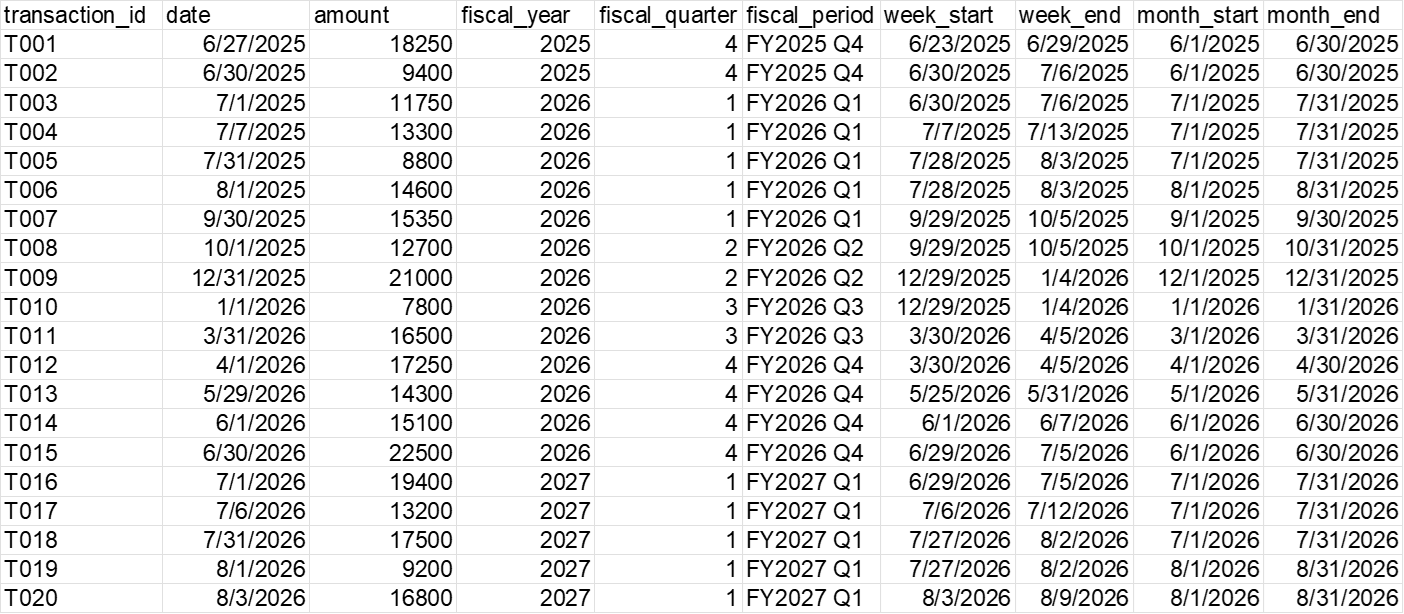
Take June 30 and July 1, 2025. They fall in the same Monday-to-Sunday reporting week, June 30 through July 6. But June 30 is still FY2025 Q4, while July 1 is FY2026 Q1. The same thing happens again at June 30 and July 1, 2026.
You can spot other boundaries too. December 31, 2025 and January 1, 2026 fall in the same reporting week, but one is FY2026 Q2 and the other is FY2026 Q3. July 31 and August 1 belong to different reporting months even when they happen to share the same business week.
That is the point of keeping these fields separate. Fiscal quarters, business weeks, and calendar months overlap in ways that do not always line up neatly, and now each transaction carries all of those labels.
From there, we can actually use them. For example, summarizing sales by fiscal quarter is straightforward:
fiscal_summary = (
    sales
    .groupby(
        [
            "fiscal_year",
            "fiscal_quarter",
            "fiscal_period"
        ],
        as_index=False
    )["amount"]
    .sum()
    .sort_values(
        ["fiscal_year", "fiscal_quarter"]
    )
)

fiscal_summary
Now the totals follow the fiscal calendar we defined earlier. FY2026 Q1 totals $63,800, while Q2 comes to $33,700, Q3 to $24,300, and Q4 to $69,150. Taken together, the transactions in our sample give FY2026 a total of $190,950.

And notice that the July 2026 transactions have already rolled into FY2027 Q1, which totals $76,100 in this sample. That is exactly what we want with a June year-end: the grouping follows the company’s reporting calendar rather than the year printed on the transaction date.
Check the edge cases
Fiscal calendars are exactly the kind of thing where I want to check the boundary dates instead of just assuming the logic is right.
For a June year-end, these transitions should be pretty clear:
2025-06-30 -> FY2025 Q4
2025-07-01 -> FY2026 Q1

2026-06-30 -> FY2026 Q4
2026-07-01 -> FY2027 Q1
We can check those directly:
expected = {
    pd.Timestamp("2025-06-30"): "FY2025 Q4",
    pd.Timestamp("2025-07-01"): "FY2026 Q1",
    pd.Timestamp("2026-06-30"): "FY2026 Q4",
    pd.Timestamp("2026-07-01"): "FY2027 Q1"
}

boundary_checks = sales.loc[
    sales["date"].isin(expected),
    ["date", "fiscal_period"]
].copy()

boundary_checks["expected"] = (
    boundary_checks["date"].map(expected)
)

boundary_checks["matches"] = (
    boundary_checks["fiscal_period"]
    == boundary_checks["expected"]
)

boundary_checks
Here I am basically creating a small answer key. The expected dictionary says what each boundary date should be labeled, and then we compare that against the fiscal period pandas actually calculated.

The result is what we want: all four boundary dates match. June 30 stays in Q4 of the fiscal year that is ending, while July 1 immediately rolls into Q1 of the next fiscal year. Seeing both the 2025 and 2026 transitions behave the same way gives me a little more confidence that the rule is doing what I intended.
I also like adding a few broader sanity checks for the rest of the calendar fields:
checks = pd.DataFrame({
    "check": [
        "fiscal quarters are between 1 and 4",
        "all business weeks start Monday",
        "all month starts are day 1",
        "all month ends are month-end",
        "all fiscal boundary checks passed"
    ],
    "passed": [
        sales["fiscal_quarter"].between(1, 4).all(),
        sales["week_start"].dt.weekday.eq(0).all(),
        sales["month_start"].dt.day.eq(1).all(),
        sales["month_end"].dt.is_month_end.all(),
        boundary_checks["matches"].all()
    ]
})

checks

All five checks come back True. So our quarters stay between 1 and 4, every reporting week starts on Monday, the month-start and month-end fields really do land on their respective boundaries, and the fiscal-year transitions match our expectations.
I am not trying to turn this into a software-testing exercise. I just want a quick way to catch an obvious calendar mistake before these fields start driving summaries and reports.
Conclusion and next steps
If I only needed one fiscal-year helper column, I would probably just use an Excel formula.
Where Python starts making more sense to me is when the calendar itself becomes part of the analysis. Maybe I need fiscal years, quarters, custom weeks, month-end logic, holiday flags, business-day counts, or some other company-specific reporting convention.
At that point, I would rather keep those rules together in one pandas workflow than spread them across a growing collection of worksheet formulas and helper columns. It also gives me one place to change, check, and extend the calendar logic later.
And because this is Python in Excel, the result still comes right back into the workbook as ordinary dates, numbers, and text.
If you want to go further with pandas and other practical analytics inside Excel, I cover this kind of workflow in much more depth in my upcoming book, Python in Excel for Data Analytics: