What makes data clean? You may not be able to name those qualities, but you likely know messy data when you see it. In this blog post, we’ll look at a frequent offender: unpivoted data. You’ll learn what this is, how it can make for “tidier” data, and how to unpivot in Excel Power Query, R, and Python.
For more on replicating and building upon your Excel work in Python and R, check out my book Advancing into Analytics.
The dataset
We will use the Wholesale Customers dataset from the inimitable UC Irvine Machine Learning Repository. You will see that it has sales amounts for different departments along the columns plus some other attributes.
Let’s say we wanted to get total sales by region from this data. How would you do it? I for one would use a PivotTable… but I ran into a problem doing that, as seen here:
The issue is that each department is considered its own variable. I don’t just want to know the total for milk versus frozen, I want to know the total, total.
The problem
So what exactly is going wrong here? To answer, we’ll use statistical programmer extraordinaire Hadley Wickham’s conception of tidy data. One of the principles:
Each variable must have its own column.
Rule 1 of what makes data “tidy”
In this case, Fresh, Milk, and so on shouldn’t be their own variables — they are, after all, measuring the same thing, sales.

The solution
To “tidy” this data, we want to turn the seven columns starting at Fresh into two: Category and Sales. If you think about the shape of the dataset, it’s as if we are converting it from “wide and short” to “narrow and long.” This is known as unpivoting data.
As I like to emphasize, steps like unpivoting are relevant regardless of the program you’re working in. Here we’ll reproduce the same solution in Excel Power Query, R, and Python. Which tool you end up using for a real life project has to do with many circumstances, including which slice of the data analytics stack is best served to meet the objective.
Excel Power Query
We’ll first tackle the unpivot in Excel, particularly using Power Query. To follow along, you can download a copy of the workbook featured previously by clicking the first icon on the bottom-right of the pane. (This file also contains a solution worksheet, so no peeking!)

Click anywhere inside the dataset on the raw-data worksheet and from the ribbon go to Data > From Table/Range.
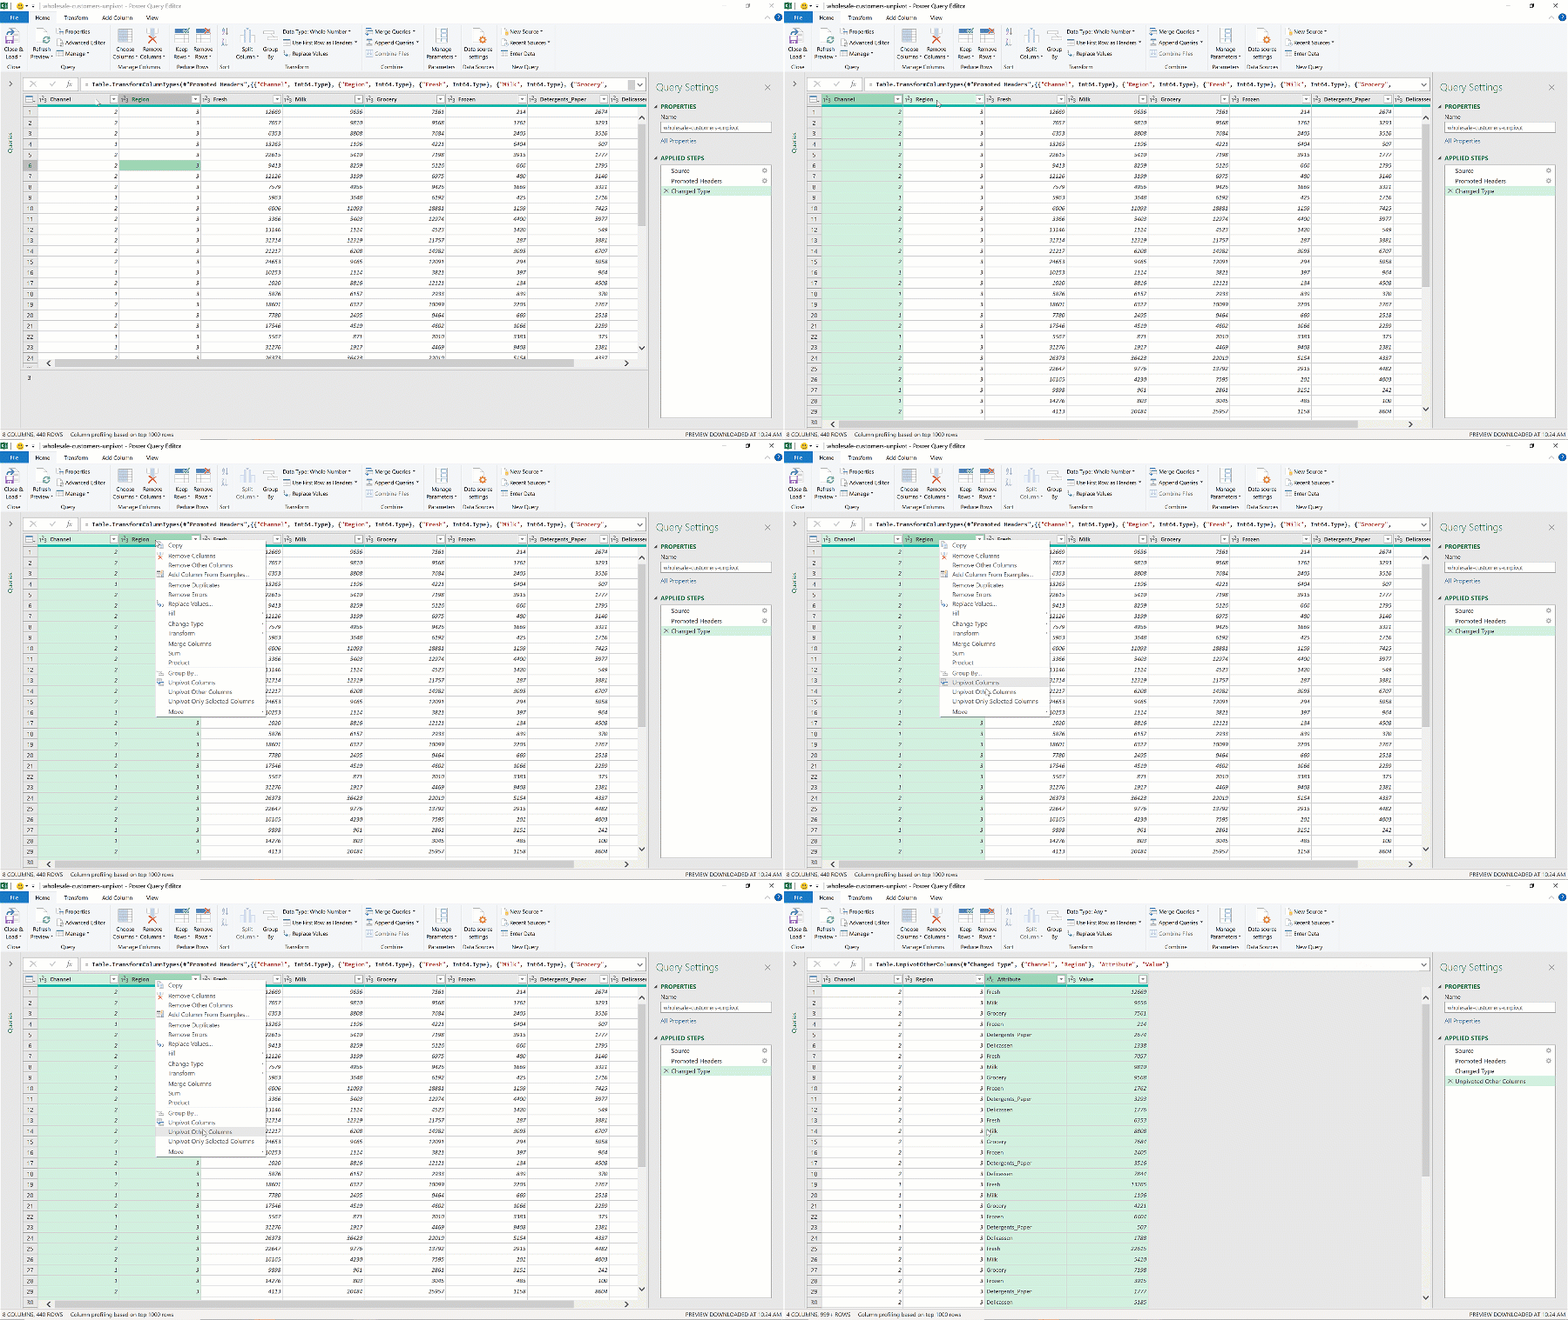
This will open up the Power Query editor. You will now see the dataset in the center of your screen. Hold down the Ctrl key and select the first two variables, Channel and Region. Right-click and select Unpivot Other Columns:

By default, Power Query named the two resulting columns (and we wanted two!) Attribute and Value. Let’s rename them to our preferred Category and Sales. Finally, we’ll admire our work inside of an Excel worksheet by selecting “Close & Load” from the ribbon.
If you’d like more practice with Power Query, I suggest reading M is for Data Monkey by Ken Puls and Miguel Escobar and perusing Oz du Soleil’s YouTube channel.
Once loaded back to Excel you will see something like this:
R
For R, we will use tidyr, a core tidyverse package. In particular, the pivot_longer() function to “lengthen” data. Check out the. To run R with Jupyter Notebooks on your machine as done below, follow these steps from Anaconda.
You’ll notice that the number of rows and columns in the unpivoted R dataset are the same as those in Excel. Nice work!
Python
We will use the one, the only pandas package to unpivot in Python, specifically the melt() function:
Yet again, we retrieve the same data.
Many languages, one goal
I find it helpful to emphasize to data newcomers that even though each tool has its own way of working with data, with its strengths and weaknesses, the “grammar” of how to work with data remains consistent. For example, whether we unpivot a dataset in Excel, R or Python, we should get the same results (and did).
What data cleaning tasks do you find particularly easier to perform with one of these tools? Or are they about the same? Or, do you want to check out Advancing into Analytics first to learn the basics of data analysis in these three tools? Let me know in the comments.
