An essential step toward understanding any information system is defining its building block, or lowest common denominator.
Priligy (Dapoxetina) aiutano a prolungare i rapporti sessuali in media di 30-40 minuti. Aiutano a prolungare il rapporto sessuale, dando così piacere dal contatto intimo. È possibile acquistare Priligy (Dapoxetine) senza prescrizione in farmacia https://www.maximopillola.it/priligy-online-italia online. Aiutano a prolungare il rapporto sessuale, dando così piacere dal contatto intimo.
What is the most granular level of information that cannot be drilled down into any further? How do these building blocks interact to form higher levels of information?
The cell is the basic unit of information in an Excel workbook. R’s building block is the vector. While similar in theory, vectors are used a bit differently in R than cells are used in Excel.
Cells vs. Vectors: An Example
Let’s say you want to find the greatest of a column of five numbers.
Excel: One Value Per Cell
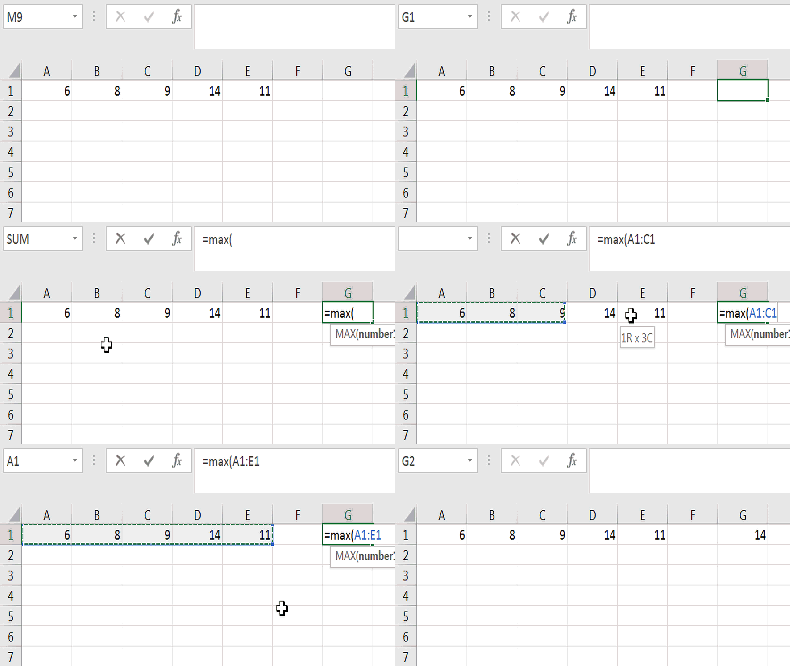
In Excel, each of those five numbers goes in its own cell, and in another cell goes the function to find the greatest of the five:

Cells are the basic source of information, and each cell contains one value.
Let’s now do the same operation in R.
Vectors: Multiple Values in One
Think of a vector as a mini-Excel row or column. In our case, this vector will be a set of five numbers. But vectors can take other forms of information, too. In Excel, we put one value per cell. But an R vector can contain more than one piece of information.
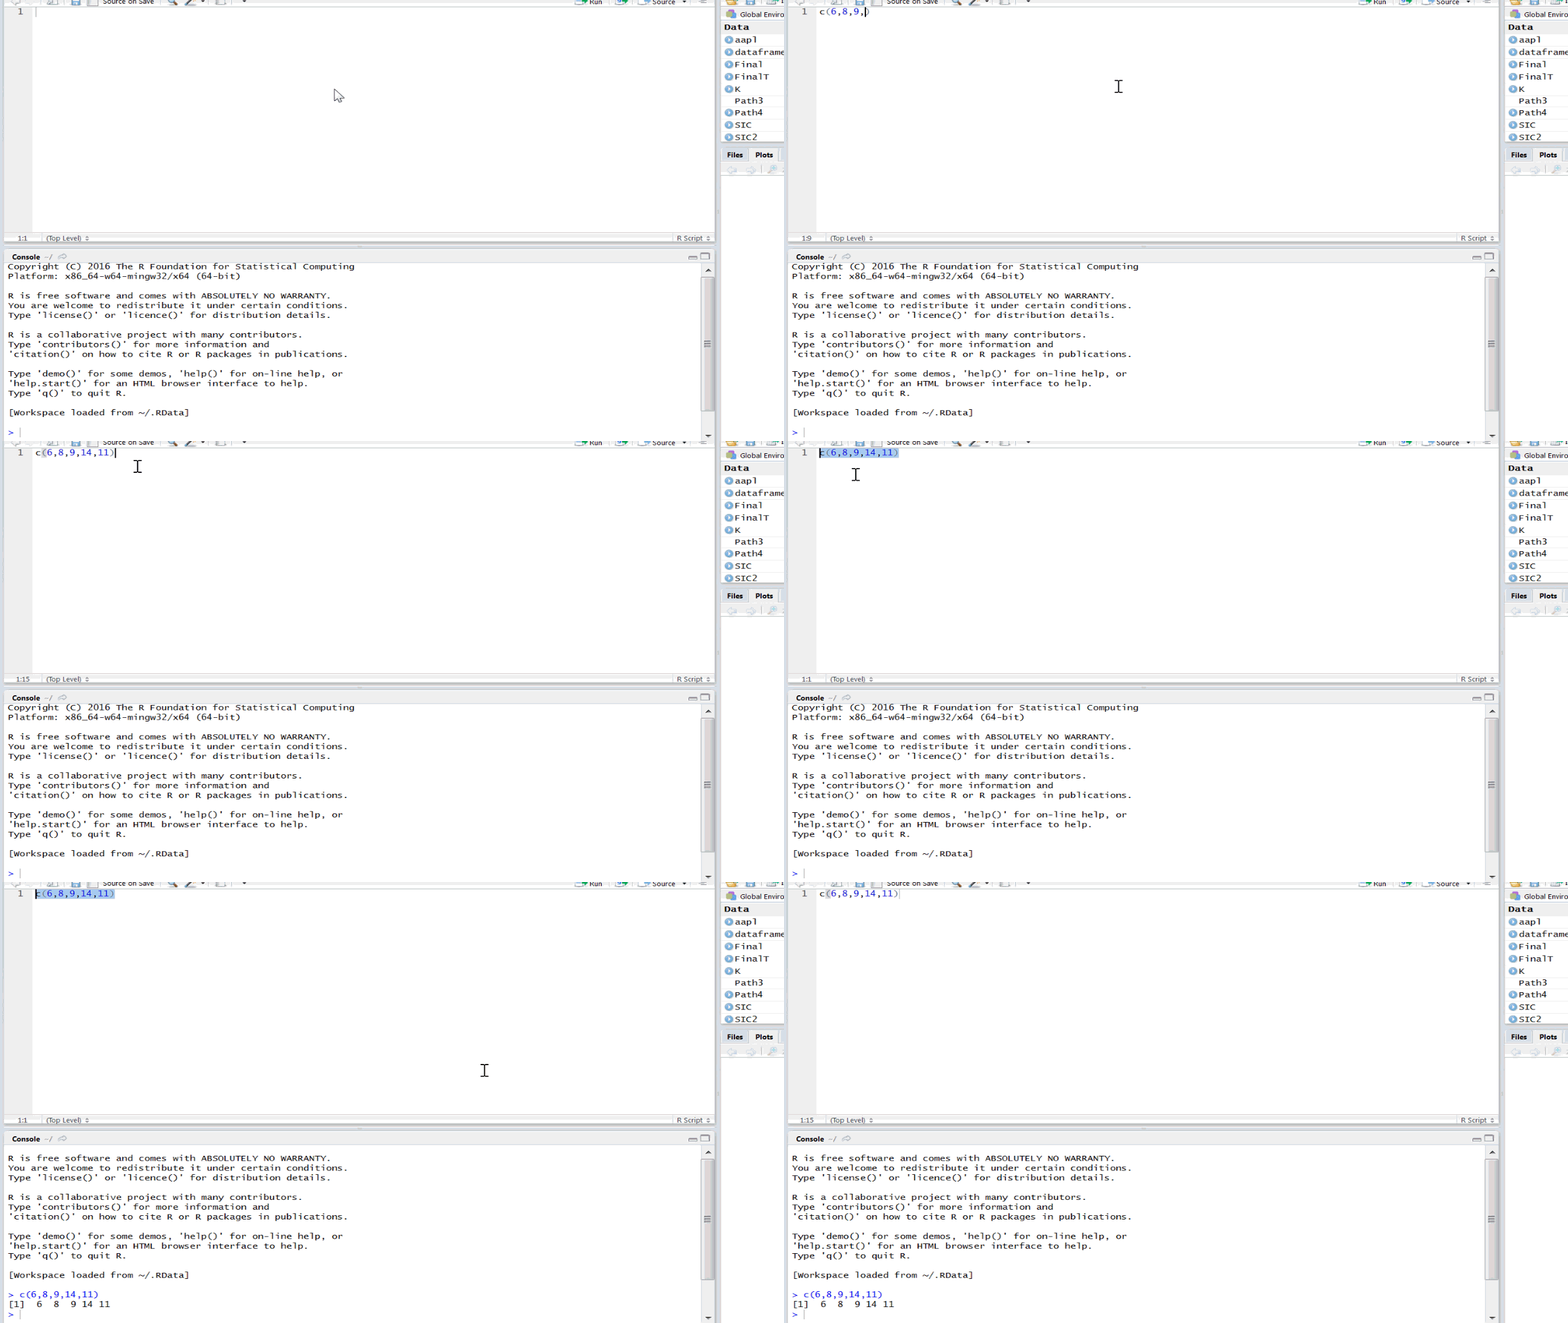
Here we are recreating our row of five numbers as found in the spreadsheet.
The “c” function stands for “combine” and makes the numbers inside the parentheses into a vector. Notice the console (bottom half of the screen) shows the resulting vector once I run the line.

Pointing Your Vector to a Variable
To perform functions on Excel cells, you simply point and click to another cell and write your calculation.
In R, it’s a good idea to point the vector to a variable, and then perform your calculation. I will call our new variable “x”.

Notice that when I write and run the variable “x” I now receive the vector’s values.
From here, we’re in the home stretch! The MAX function in R works just like it did in Excel.

Hey, it must have worked — we got the same answer each time!
But Wait, There’s More (Data)…
I hope this lesson gives you an idea of how R is designed compared to Excel. R is built for data-crunching, and the vector is a great first way to harness that power.
