Like in Excel, data in R comes in different shapes and sizes. In Excel, there are cells, ranges, worksheets and so forth.
R does things a bit differently. Ultimately, these difference come down to the use of a vector as its information building block.
Picture a table in Excel. If you know how to design a PivotTable-friendly data source in Excel, then you basically already understand a data frame in R.
An Excel table is a collection of columns with the same number of cells. Similarly, an R data frame is a collection of vectors of the same size (this part is important!).
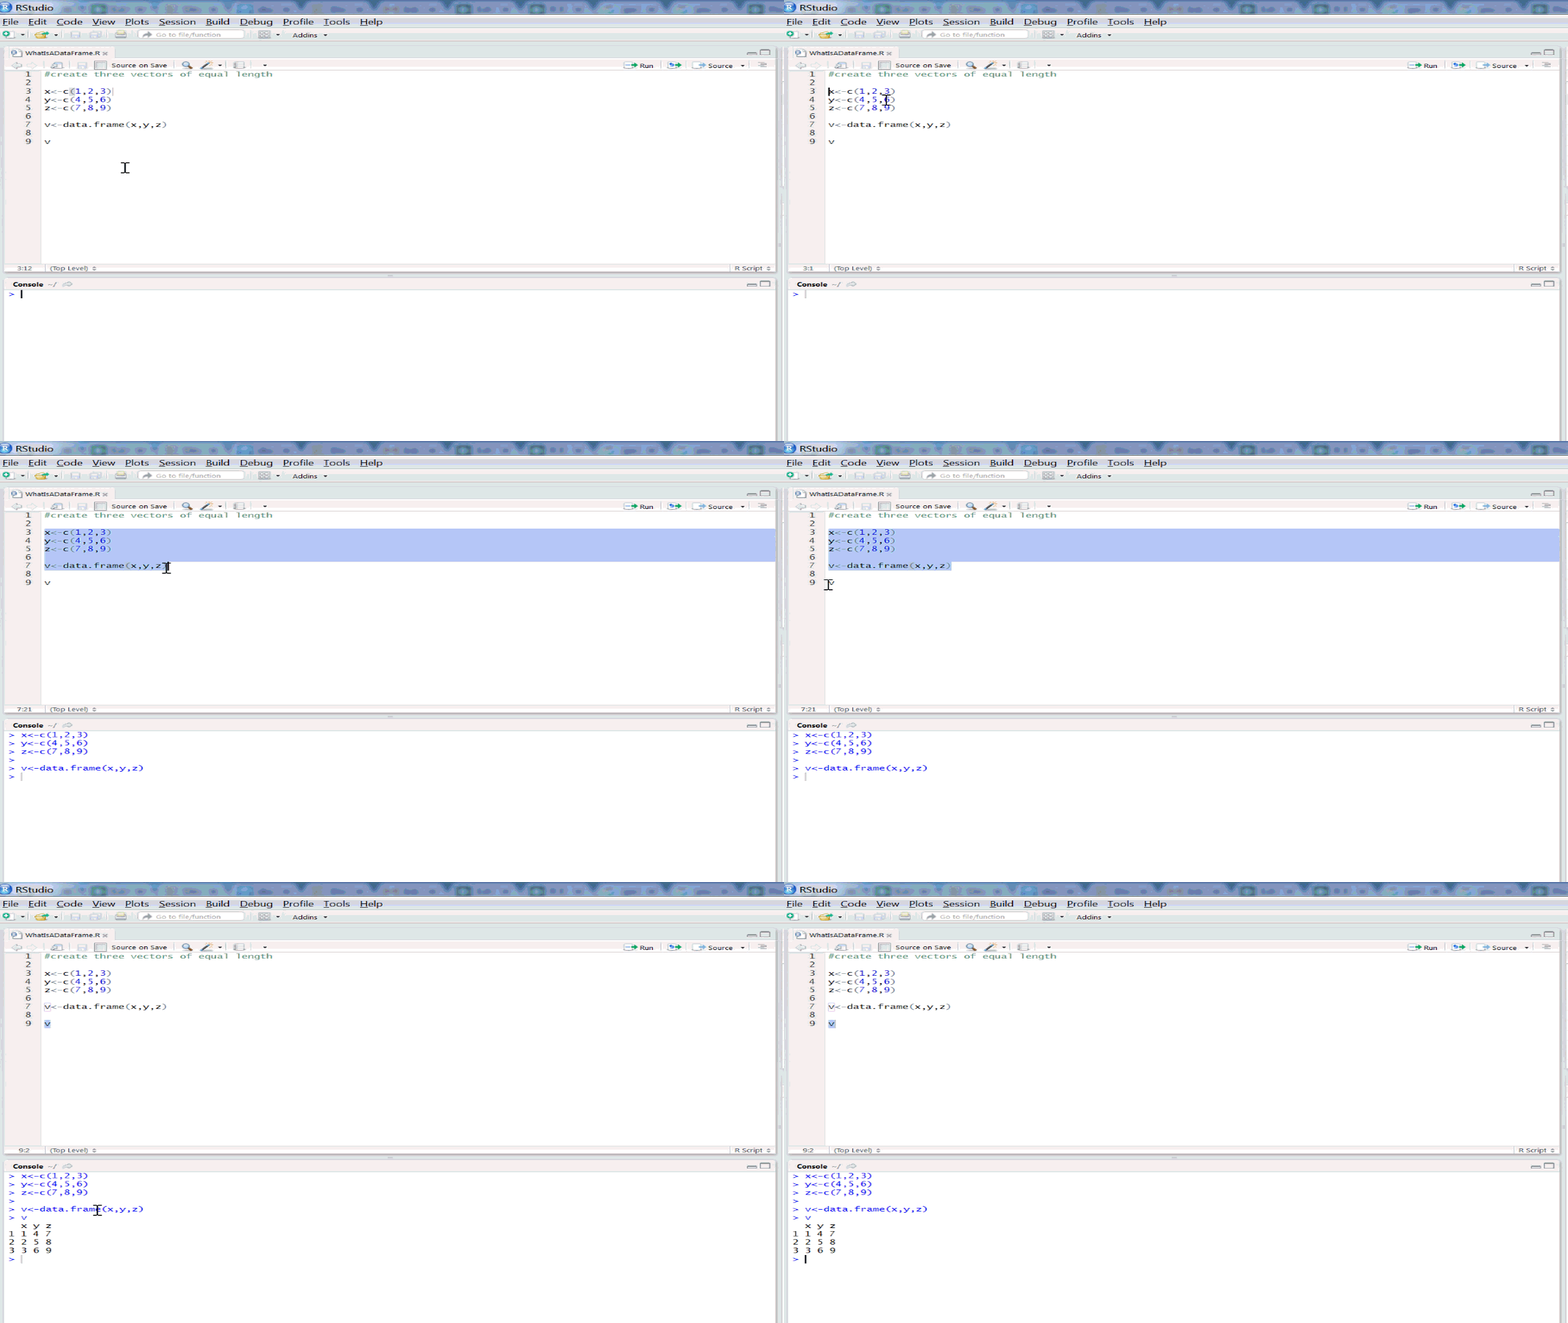
Let’s see an example below. Follow along with the source code at the bottom of this post.
Here we create three vectors of equal length and pass each to a variable.

After creating these three vectors, I use the data.frame function to combine these in to one data frame. The result looks a lot like a good Excel table, and can be used in similar ways.
(How, exactly? Subscribe to the blog and I’ll keep writing. Deal?)
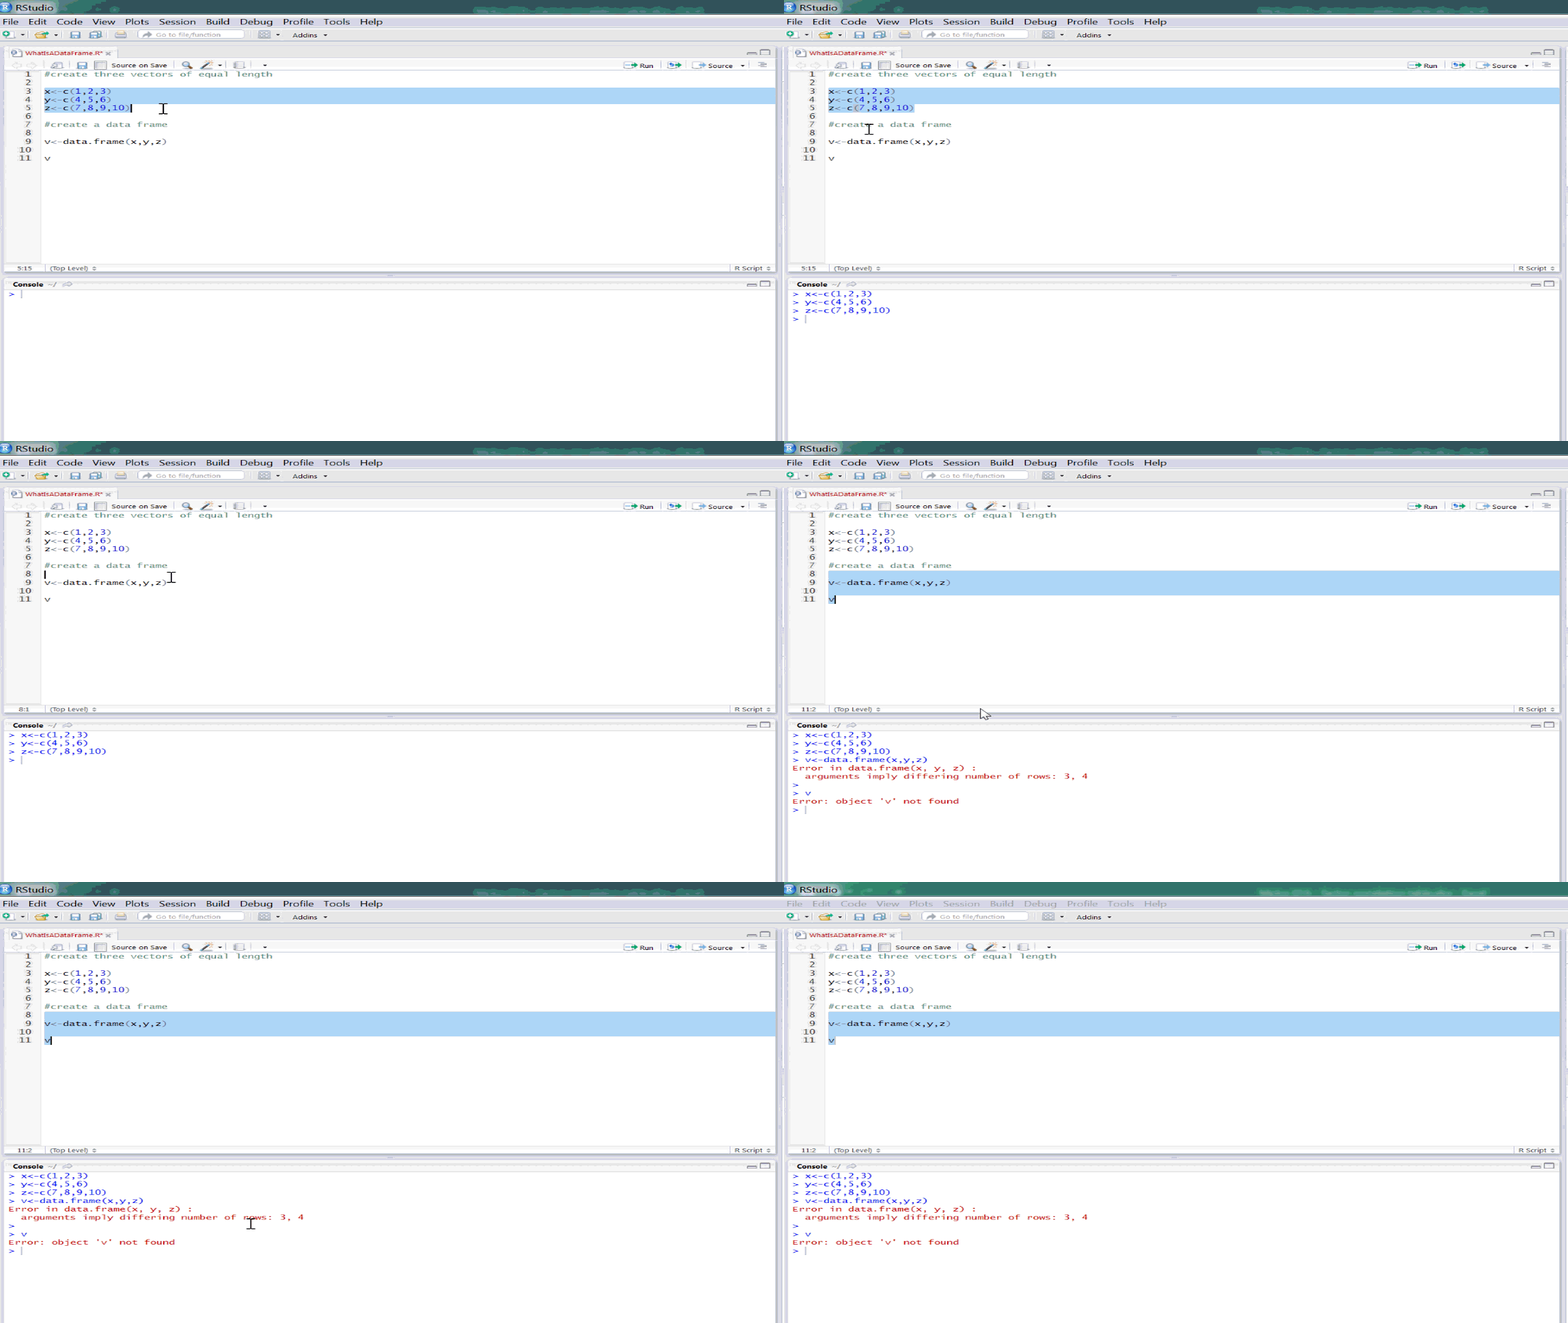
Note that when I add a fourth number to one vector, the data frame will not assemble.

To meet that need we will look at other data structures — but not now. Subscribe, and I will tell you when!
Code below:
