
K-Nearest Neighbors (KNN) is a straightforward and powerful analytical tool that helps you make predictions by looking at the most similar cases or “neighbors” in your data. It’s intuitive because it mirrors how we often make real-life decisions: by finding similar past scenarios and expecting similar outcomes.
Historically, though, Excel users faced significant challenges when attempting to implement KNN, as Excel has no built-in functionality for this method. Analysts had to rely either on external software or complex, error-prone spreadsheet formulas.
Fortunately, this hurdle no longer exists. With Python integration and Copilot’s Advanced Analysis directly inside Excel, running KNN models has never been easier. You can now use Python’s predictive power effortlessly within Excel, guided clearly through each step by Copilot.
In this post, we’ll use Python and Copilot in Excel to demonstrate how analysts can quickly build and interpret KNN regression models. Using the popular Auto MPG dataset, we’ll predict car fuel efficiency based on attributes like horsepower, weight, and acceleration. Download the exercise file below to follow along:
Setting the business context
We begin our analysis with the following prompt to ensure a clear understanding of our data and why we’re using KNN:
“Briefly summarize what this dataset is about and explain how using K-Nearest Neighbors could help an analyst predict car fuel efficiency (MPG).”
Copilot responds with a concise summary of the dataset and clearly articulates the value of KNN for the business problem at hand:
Preparing your data for KNN
Because KNN relies on measuring the distance between data points, it’s essential that your features are similarly scaled and clean of missing values or extreme outliers. Use the following Copilot prompt to handle this step:
“Check the dataset for missing values and extreme outliers in horsepower, weight, and acceleration. Standardize these features so they have comparable scales. Briefly explain why this step matters for KNN.”
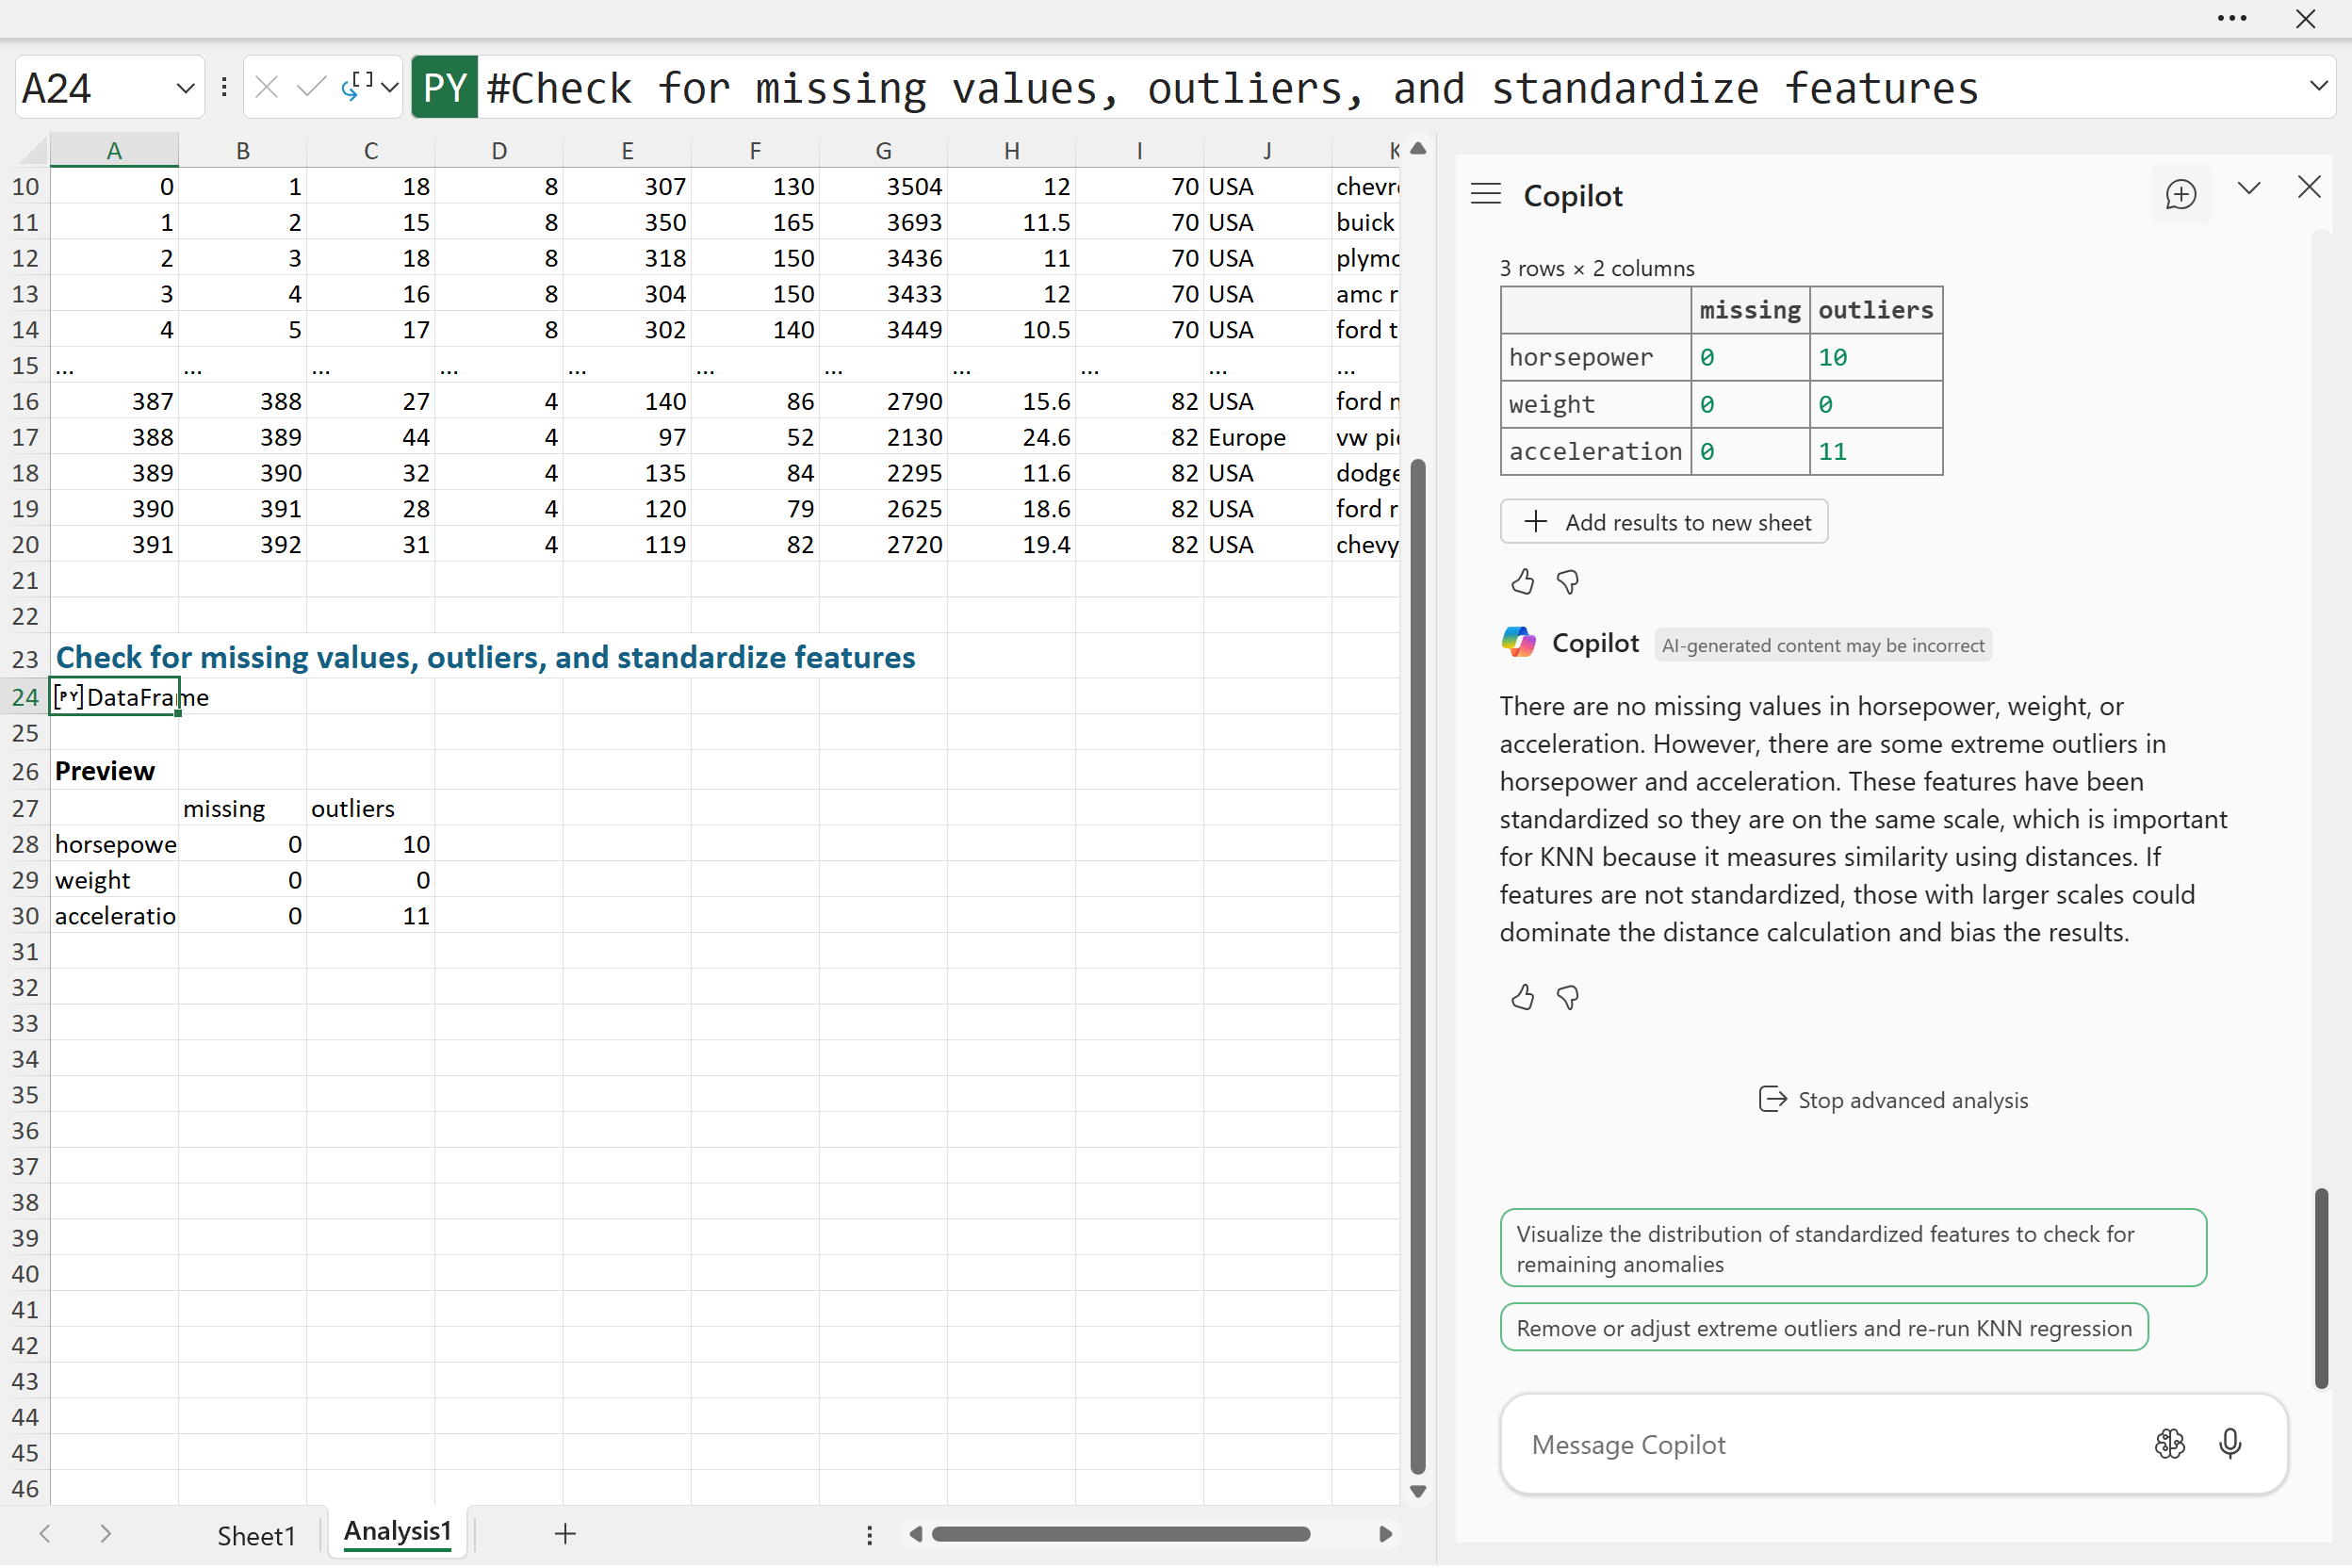
It confirmed clearly that there are no missing values in any of our chosen features. This is good news. It means every data point is valid and usable for analysis. However, Copilot did identify several extreme outliers: 10 in horsepower and 11 in acceleration. Extreme values like these can significantly impact the accuracy of KNN predictions, as they can distort distance calculations between data points.
Copilot’s output also explains why standardization is critical for our KNN model. Because KNN works by measuring the similarity between observations using distance metrics, features measured on different scales can bias these calculations. Without standardization, larger numeric scales (like weight) would overshadow smaller ones (like acceleration), even if they’re equally important. By standardizing our features, we ensure that each contributes equally when determining similarities and predicting fuel efficiency.
Building the KNN model
Next, we’re ready to build our KNN model and start making predictions. To do this, we asked Copilot the following prompt:
“Build a basic KNN regression model to predict MPG using horsepower, weight, and acceleration. Briefly explain how this model uses these features to make predictions.”

Copilot responded clearly, building a KNN regression model that predicts fuel efficiency (MPG) based on three important car attributes: horsepower, weight, and acceleration. The way KNN regression works here is quite intuitive: when we want to predict MPG for a new car, the model searches the dataset for cars with similar horsepower, weight, and acceleration… the “nearest neighbors.” It then averages the actual MPG of these nearest neighbors to estimate the MPG of our new car.
In this case, Copilot specifically selected five similar cars to make each prediction. It also provided us with a measure called mean squared error (MSE), which came out to about 16.26. The MSE tells us how close, on average, our predictions are to the actual MPG values. A lower MSE means predictions are generally closer to reality, while a higher MSE means there’s more room for improvement.
You might be wondering why we’re calling this “KNN regression.” That’s because KNN can be used in two main ways: regression and classification. In our scenario, we’re performing regression since we’re predicting a numeric outcome (MPG). Alternatively, KNN classification predicts categorical outcomes, such as whether a customer churns (“yes” or “no”) or identifying a product category.
If you’re curious or feel unclear about these concepts, feel free to ask Copilot to further clarify the difference between KNN regression and classification… it’s always ready to help you build confidence and understanding as you continue your analytics journey!
Evaluating the KNN model
Next, we want to be sure our KNN regression model genuinely works… not just on cars it’s already seen but also on new, unseen examples. To accomplish this, we gave Copilot the following prompt:
“Split the data into training and testing sets (80/20). Train the KNN model on the training set and evaluate its prediction accuracy on the testing set. Explain briefly why this testing step is important.”
Copilot split the data, trained the KNN regression model on the training set, and evaluated predictions on the test set, resulting in a mean squared error (MSE) of approximately 16.26. This testing step is crucial because it ensures our model reliably predicts MPG for new cars it hasn’t encountered before, rather than just memorizing data it’s already seen.
Notably, this MSE of about 16.26 matches our earlier result, suggesting the model is stable and consistently reliable across different subsets of data.
Visualizing KNN predictions
Next, we want a clear visual sense of how well our KNN regression model predicts MPG compared to actual values. We used the following prompt:
“Create a scatter plot showing actual versus predicted MPG. Briefly interpret the visualization. Does the model predict accurately across all ranges?”

Looking at our visualization, we see most points cluster closely around the red dashed line, indicating that overall, our KNN model predicts fairly accurately. However, we notice some variation, particularly at the higher MPG range, where predictions deviate a bit further from the perfect prediction line.
This pattern suggests our model does better at predicting mid-range MPG values, while slightly struggling with extreme cases. Understanding these strengths and limitations helps us trust the model’s insights appropriately and identify where improvements might be beneficial.
Optimizing our model
Lastly, we wanted to fine-tune our KNN model by determining the optimal number of neighbors (k) to use. For this, we gave Copilot the following prompt:
“Run the KNN model again using 3, 5, and 7 neighbors. Identify which number of neighbors (k) produces the lowest prediction error and briefly explain why choosing the right number of neighbors matters.”

Copilot tested our KNN model using three different neighbor counts (3, 5, and 7) and returned the clear table shown in our screenshot. From this table, we see that the mean squared error (MSE) is lowest—about 15.72—with 7 neighbors. However, the MSE at 5 neighbors is very similar (around 16.26), and we’ve already seen consistent, stable results at this number.
While the error with 7 neighbors is slightly lower, sticking with 5 neighbors makes practical sense. A model that’s slightly simpler (fewer neighbors) tends to be easier to interpret and faster to calculate. Given that the difference in accuracy is minimal, choosing 5 neighbors offers a good balance of simplicity, interpretability, and prediction accuracy, ensuring stable and reliable results without unnecessary complexity
Understanding predictions for better decisions
Finally, we asked Copilot to provide an intuitive example to clearly understand how our KNN model makes predictions:
“Select one vehicle from the test dataset and identify its three closest neighbors used in the prediction. Briefly explain how the similarity between these vehicles (in terms of horsepower, weight, and acceleration) helps us intuitively understand why the model predicted its fuel efficiency (MPG) as it did.”

Copilot responded by selecting one vehicle from the test set with a horsepower of 69, weight of 2189, acceleration of 18, and actual MPG of 26. It identified the three most similar cars from the training dataset, each with very comparable horsepower (65-67), similar weights (2065-2145), and nearly identical acceleration values (17.8-18). These vehicles had actual MPG values of 33.8, 46.6, and 32.3.
Because these vehicles are so closely matched in their key features, Copilot averages their MPG to make a prediction. This similarity-based reasoning makes KNN highly intuitive. By clearly seeing how similar cars performed, we gain trust in the model’s prediction. It’s essentially making recommendations based on how similar situations turned out in the past. This practical, intuitive insight makes KNN regression especially useful for analysts who value clear interpretability in their models.
Conclusion
K-Nearest Neighbors models offer Excel analysts a simple yet powerful tool for predictive analysis, bridging intuitive decision-making with data-driven insights. Thanks to Python and Copilot integration, building and interpreting these models is now accessible directly within Excel. This empowers analysts in marketing, finance, and operations to confidently predict outcomes, test business scenarios, and provide actionable recommendations—all without extensive coding or statistical training.
As with any analytical method, KNN’s effectiveness hinges on data quality and thoughtful parameter tuning. Regularly revisiting your model with new data and adjusting your approach ensures your insights remain practical and impactful.
Looking forward, analysts can explore other predictive modeling methods, comparing results with KNN to reinforce conclusions. The combination of your domain knowledge with these intuitive predictive tools ensures your recommendations remain insightful, actionable, and aligned with real-world business objectives.