
Many Excel users spend hours each week creating reports, exporting data, and sending the same updates around. It works, but it’s repetitive and time-consuming. A smarter option is to bring those insights straight into Teams, where your colleagues already communicate.
In this tutorial, you’ll build an automated Teams update that summarizes your Excel data in clear, natural language. Power Automate will trigger the flow, run an Office Script to calculate results, and post the summary as an Adaptive Card directly in Teams.
Adaptive Cards are flexible messages that display text and data dynamically. They make it easy to share insights without exporting or attaching files. By the end, you’ll have a fully automated way to keep your team informed—no dashboards or email attachments required.
To follow along, download the sales data exercise file below and upload it to your OneDrive or SharePoint.
For this post, I’ll assume you’re already familiar with saving and running Office Scripts, as well as building simple flows in Power Automate. If you’d like a refresher, you can check out my LinkedIn Learning courses for a step-by-step introduction.
Our first step will be to create an Office Script that calculates a few simple metrics from the sales table, such as total revenue, average unit price, and the top-performing region. It also defines variables that Power Automate can later use to build our Teams message.
With the Office Script saved, go to make.powerautomate.com to build the flow. This is a good candidate for a scheduled flow, since the goal is to post regular updates automatically. I’ll set mine to run once a week to generate and share the latest report.
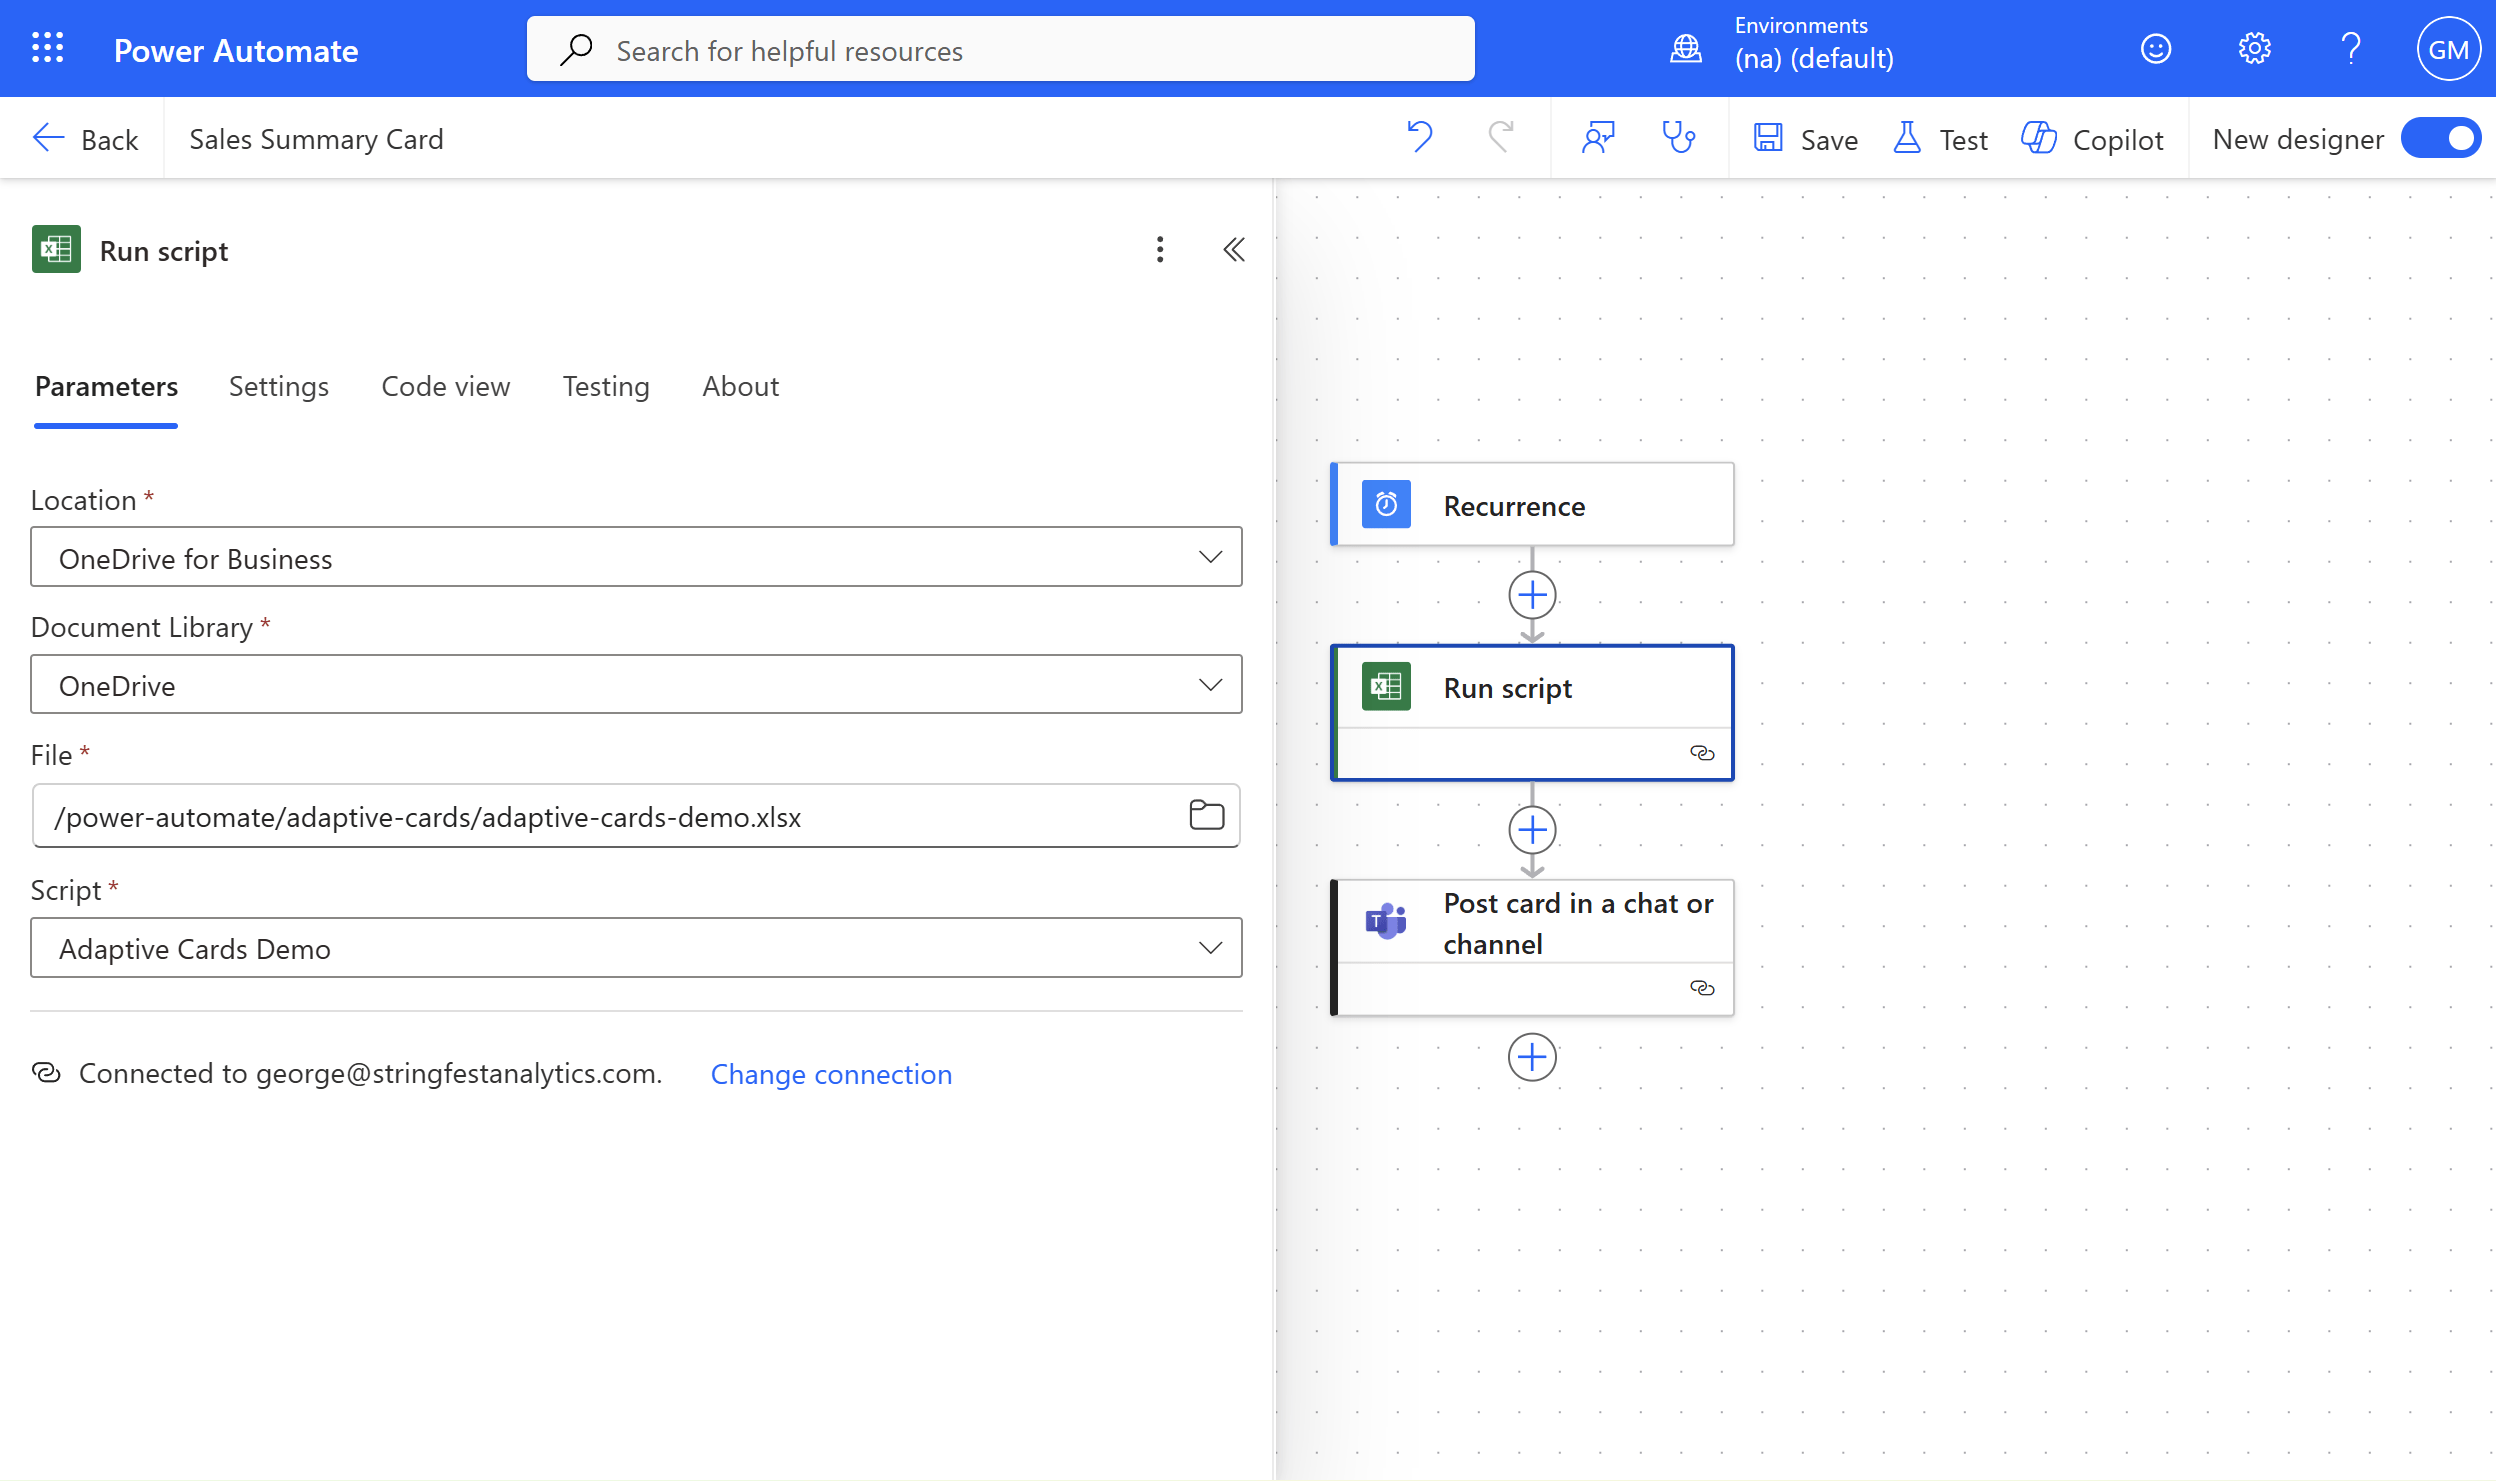
Once the flow is triggered, the next step is to run the Office Script. In this action, map it to your Excel workbook and select the script you just created:
The next step is to post the Adaptive Card in Teams. In Power Automate, choose how and where the card will appear, then paste in the card’s code. The code below is written in JSON, which is the format Microsoft uses to describe the layout and content of an Adaptive Card.
JSON stands for JavaScript Object Notation. It’s a simple way to organize information so that different applications can read and display it consistently. Each part of the Adaptive Card, such as text blocks or facts, is defined as an object in this structure. That tells Teams exactly what to show and how to format it.

Use the following code as your starting point. In the next step, we’ll map our dynamic outputs from Power Automate into this template so the values from Excel appear automatically in the card.
Inside this JSON code you’ll see placeholders for Total Revenue, Average Unit Price, and Top Region. In each of those places, delete the example values and replace them with dynamic content from the Office Script step.
| Total Revenue | formatNumber(outputs('Run_script')?['body/result/totalRevenue'], 'C2', 'en-US') |
| Average Unit Price | formatNumber(outputs('Run_script')?['body/result/avgUnitPrice'], 'C2', 'en-US') |
| Top Region | outputs('Run_script')?['body/result/topRegion'] |
The first two fields will use short Power Fx expressions to format the numbers so they appear cleanly in the card. Insert each expression in the correct field and keep the quotation marks in place. The variables should appear inside the quotation marks so that the JSON structure remains valid.
Your adaptive card parameter should look something like this:

Great work getting this far! The final step is to save and test your flow. Be sure to choose a manual test run, or you’ll have to wait until the next scheduled time for it to trigger automatically.
If everything is set up correctly, you’ll see a neatly formatted post appear in your Teams channel that looks like this:

Conclusion
There are a few limits to keep in mind. To include a chart or image, for example, you’d need to store it in OneDrive or SharePoint and link to it from your card, since Power Automate can’t display embedded images directly. It’s also possible to create similar cards for Outlook, though that setup requires additional permissions and configuration through Microsoft Graph, which makes Teams the simpler option for most users.
Even so, this approach shows how Excel can go beyond static reports to deliver insights directly where work happens. Instead of relying on people to open a dashboard or dig through an attachment, you can bring short, meaningful summaries right into Teams. That immediacy keeps data visible and actionable, which is exactly what most teams need.
Once you understand this workflow, you can schedule recurring updates, trigger alerts when certain thresholds are met, or post results automatically when new data arrives. You could even take this a step further by pairing the process with generative AI to create dynamic, natural-language reports that adjust to your data in real time. That’s something we may explore in a future post.
Power Automate and Office Scripts make it possible to connect Excel with the rest of your Microsoft 365 environment and turn your workbook into part of a living workflow rather than a standalone file.