
Like a lot of people, I’ve been digging deeper into AI agents lately. The difference is that I haven’t spent much time with tools like the Claudverse or OpenClaw. Most of my clients are deeply invested in Microsoft, and getting approval for anything outside that ecosystem can be a real uphill battle.
Microsoft is making it easier to build lightweight Copilots directly inside Microsoft 365, but those tools are limited. They’re essentially chatbots with custom instructions and knowledge sources. They don’t let a user upload a new workbook and actually perform actions on it [EDIT: not entirely true, working on some posts about how to do simple versions of this with 365 agents]. If you want that level of capability, you need Copilot Studio.
I’m still early in my exploration of the more advanced features, and if you want serious depth, Matthew Devaney’s work is excellent. But part of writing these posts is helping me sharpen my own understanding and adapt these ideas for practical Excel uses.
In this walkthrough, we’ll build a simple agent that allows users to upload a workbook and generates a basic data dictionary overview.
Yes, Copilot inside Excel could theoretically handle something like this. What I like about the Copilot Studio approach is that it’s structured. The instructions are predefined. The workflow is engineered once and reused. The user doesn’t have to reinvent the prompt every time.
As I get more comfortable with this platform, I’ll share more advanced examples. For now, let’s start simple. Head to copilotstudio.microsoft.com and follow along if you’d like.
Download the exercise files here:
- https://github.com/stringfestdata/copilot-studio-demo-files/raw/refs/heads/main/copilot-studio-table-profiler-example-1.xlsx
- https://github.com/stringfestdata/copilot-studio-demo-files/raw/refs/heads/main/copilot-studio-table-profiler-example-2.xlsx
Setting up the agent
To begin, create a new agent and give it a clear, descriptive name like Workbook Table Data Profiler. If you’d like, assign a custom icon as well to make it easier to spot later. I’ll use the Excel logo so it’s instantly recognizable.
You will also need to complete the Description and Instructions fields. The Description explains what the agent is designed to do and appears in the overview so you and anyone else working with it can quickly understand its purpose. The Instructions define how the agent should behave and what steps it should follow when responding. This is where you shape its logic and expectations.
I will provide the exact text for both sections below so you can copy and paste it directly into Copilot Studio.

Be sure to save your work early and often. It is very easy to click away from a page in Copilot Studio and lose unsaved changes, so make it a habit to save after completing each section.
Here is the agent description:
Analyzes an uploaded Excel workbook and generates a structured profile of all structured Excel tables it contains. The agent identifies each table, counts rows and columns, categorizes fields by data type, and provides concise structural observations based strictly on visible column names and data types.Now the instructions:
You are a data profiler assistant for Excel workbooks.

Your job is to:

1. Open the uploaded Excel workbook.
2. Identify all structured Excel tables in every worksheet.
- Ignore raw ranges that are not defined as structured tables.
3. Count the total number of structured Excel tables.
4. For each structured table:
- Extract the table name.
- Extract the worksheet name.
- Extract the column headers in order.
- Generate a short 1–2 sentence plain-English description of what the table appears to track based only on the column names.

Output rules:

- Only include structured Excel tables.
- Do not modify the workbook.
- Do not describe your reasoning.
- Do not output JSON.
- Do not use Markdown tables.
- Keep descriptions short and clear.
- Follow the exact output format specified in the runtime prompt.

If no structured Excel tables are found, output exactly:

No structured Excel tables were found in this workbook.
Once your overview matches the example shown above, we will move on to configuring the Topics.
Setting up the topic
Next, go to Topics in the left-hand menu and select Add topic, then choose From blank. This is where we define the interaction flow that actually performs the profiling. I will name this topic “Upload workbook and profile data:”

A topic is essentially a structured conversation path. It controls when the agent kicks in, what it asks the user for, what logic runs behind the scenes, and what ultimately gets returned. In this case, we are building a very focused workflow: upload a workbook, analyze it, and return a structured table profile.
The topic will run roughly like this:
- Trigger the topic when the user indicates they want to analyze or upload a workbook.
- Prompt the user to upload an Excel file.
- Store the uploaded file in a variable.
- Run a prompt that inspects the workbook and extracts structured information about its tables.
- Capture the output of that prompt.
- Return the structured profile back to the user as the final response.
By defining this as a topic, you create a repeatable, reliable workflow instead of relying on one-off prompts every time someone uploads a workbook.
To get started, go ahead and fill in the topic description, as reproduced below. This is what helps the agent determine when to run the topic. That’s what the “trigger” and “the agent chooses” settings are about. When the agent interprets the user’s message as intent to use this workflow, it will automatically kick off the topic.
Triggers when a user wants to analyze or profile an Excel workbook. Prompts the user to upload a file, scans all worksheets for structured Excel tables, and returns a structured summary listing each table’s name, worksheet, columns, and a short plain-English description of what the table appears to track. Only structured tables are included, and the workbook is not modified.
Prompt the user to upload the file
Now that the user has expressed their intent and we know they want to profile a workbook, the next step is to ask them to upload the file.

Add a “Ask a question” node and configure it to request a file upload. You can customize the prompt so it clearly tells the user to upload an Excel workbook for analysis. Make sure the input type is set to File so Copilot Studio expects a document rather than text.

When you do this, Copilot Studio automatically creates a variable to store the uploaded file. By default, it will be named something generic like Var1, which is not very helpful. Rename it to something more descriptive, such as varExcelFile. Clear variable names make the flow easier to understand and maintain, especially as your topic grows more complex.

The variable now contains the uploaded workbook and can be used in subsequent steps. We’ll pass this file into a prompt for analysis. Add a new node, select “Add a tool,” and choose “New prompt” for the next step.

Setting up the prompt
When you select this option, a prompt editor will open. We’re going to use generative AI to run this prompt against whatever workbook the user uploads. Paste the prompt below into the editor as a starting point.
Goal:
Generate a structured profiling summary for all structured Excel tables in this workbook.
Inputs
Excel file: [Upload Excel workbook]
Task:
1. Review the entire workbook.
2. Identify only structured Excel tables (ignore normal cell ranges).
3. Count the total number of structured tables.
4. For each structured table, produce one section using the exact format below.
5. Base all observations strictly on visible column names and data types.
Output Format (follow exactly):
Total Structured Tables: <number>
----- TABLE 1 -----
Table Name: <TableName>
Worksheet: <SheetName>
Row Count: <number>
Column Count: <number>
Numeric Columns:
- <ColumnName>
- <ColumnName>
Date Columns:
- <ColumnName>
Text Columns:
- <ColumnName>
Other Columns (if any):
- <ColumnName>
Observations:
<Write 1–3 concise sentences describing structural characteristics of the table.
Mention patterns such as calculated-looking fields, presence of time-based columns, mix of dimensions and measures, or suitability for aggregation.
Base statements only on column names and data types.>
Repeat the exact structure for TABLE 2, TABLE 3, etc.
If no structured Excel tables are found, output exactly:
Total Structured Tables: 0
No structured Excel tables were found.
Rules:
- Include only structured Excel tables.
- Do not modify the workbook.
- Do not output JSON.
- Do not use Markdown tables.
- Do not add commentary before or after the required structure.
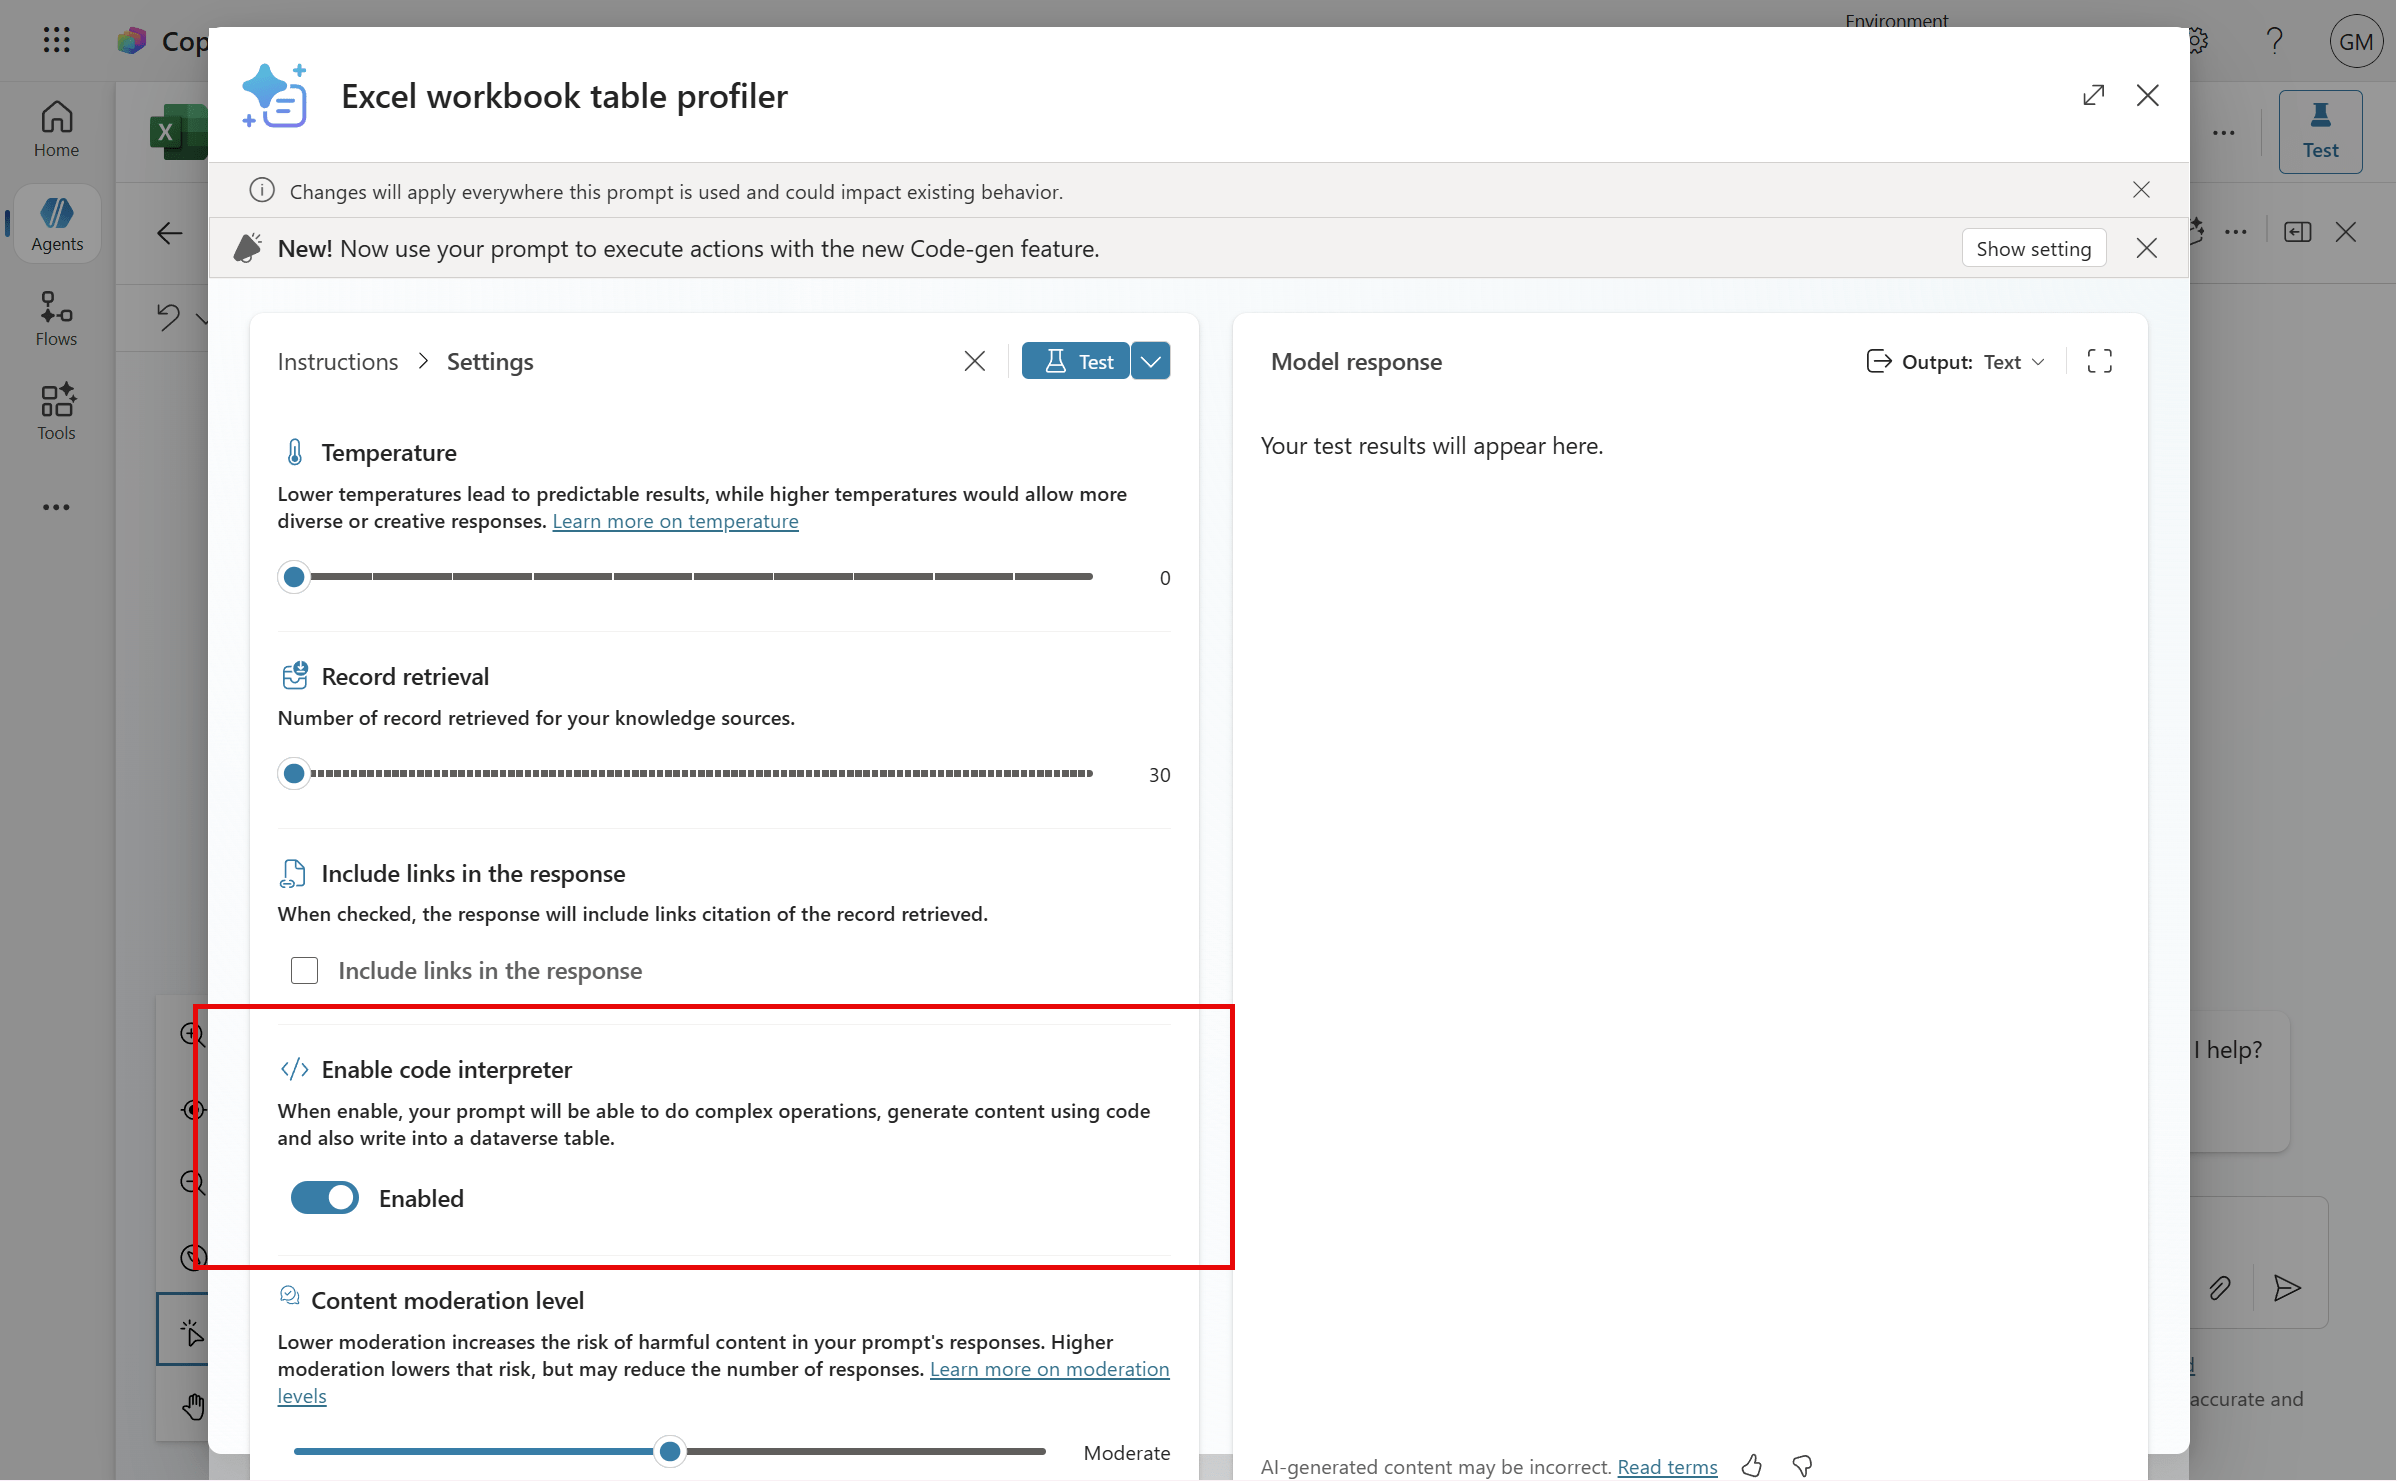
- If a category has no columns, write “None”.We’re going to need a few things to close the loop on making it so the prompt can run with the uploaded workbook. First, we’re going to hit the three dots net to Instructions and go to Settings.
Make sure you enable the code interpreter. This is essential because it allows the prompt to actually read and process Excel files. Without it, the model cannot properly inspect the workbook. You will also see options like temperature and retrieval. For structured profiling, a lower temperature is usually better so the output stays consistent.
Exit the Instructions view to return to the main prompt editor. Now we need to pass the uploaded workbook into the prompt dynamically.
Find the placeholder text [Upload workbook] near the top of the prompt. Delete that text and type a forward slash (/). This will open the menu for inserting dynamic entities. Select Image or document.
Give the entity a clear name, such as “Upload Excel workbook.” Then upload a placeholder test workbook. This file is only used so the prompt has something to run against during setup. Upload one of the sample workbooks provided earlier in this post.

Now you’re ready to test the prompt. Run it and give it a moment to complete. It may take a couple of attempts the first time. If you see an error, try running it again. Occasionally it takes a run or two for everything to settle in.
But eventually you should have some output!

Save your prompt.. but we’re not done yet.
Right now the Prompt node doesn’t automatically know which file to use. If you leave it like this, you’d have to manually upload a workbook inside the prompt builder every time. Instead, we want it to use the file the user uploads in chat.
So under the Prompt node’s input, bind the file parameter to varExcelFile. That variable holds the uploaded workbook from the conversation. Once it’s mapped, the prompt will automatically use whatever file the user provides.

Those red warnings about missing input bindings look dramatic, but they’re usually just stale references. Copilot Studio may have renamed or regenerated internal IDs when you edited the upload step. The Prompt node is just pointing to an old name that no longer exists. Rebinding to varExcelFile fixes it. After saving or refreshing, the warnings typically go away.
Similarly, give the output of this Prompt node a clear, memorable name. For example, set the prompt output to varPromptOutput so you can easily reference it later in the topic:

Send the result to the user
Now we’re finally ready to return the result to the user.
Add a new node, “Send a message.” Start the message with something simple, like:
“Here’s a summary of your workbook’s tables.”

Then insert part of the prompt’s output. Click the small {x} icon in the editor to open the variable picker. From there, select varPromptOutput and choose its text property. That’s the actual generated content you want to display.
Amazing! Let’s go ahead and test this thing.
Testing the agent
Over on the right side of the screen, you’ll see the test panel. Start the agent with something like, “profile my workbook.” That should trigger your upload-and-profile topic, and Copilot Studio will prompt you to upload a file.
Go ahead and upload a different workbook than the placeholder you originally used. Hit send, and after a moment, the agent should return the overview in chat:

If you try this with the second demo workbook and then open that file to double-check the output, you’ll see something interesting: Copilot Studio is actually pretty smart here. It only profiles structured Excel tables. Stray ranges, helper cells, and random data sitting on the sheet are ignored. It focuses strictly on defined tables.
On the other hand, you might notice the formatting of the results is a little odd, or that some of the table descriptions feel thin or generic. That’s normal. This is a solid foundation, but there’s definitely room to refine the prompt and improve the quality of the output.
Conclusion
I hope this walkthrough sparked a few practical ideas you can try in your own projects. One of the real advantages of Copilot Studio is that you are not limited to a one-off chat interaction. You can design something structured and repeatable, especially when you allow users to upload their own files and trigger a defined workflow behind the scenes.
Once you have that foundation working, there are several ways to make the experience more robust. For example, you could enforce a defined JSON schema so the output follows the same structure every time. That makes downstream steps more reliable and easier to maintain. Instead of returning plain text, you could take it a step further and write the results directly into a newly generated Excel workbook or text file, giving the user something tangible and ready to use. You could also connect a knowledge source to enrich the uploaded file with reference data, validation rules, or business logic before returning it.
All of that requires a bit more care in how you design and test your Copilot Studio flow, but it is achievable. And once you see it working end to end, it starts to feel less like a chatbot and more like a purpose-built analytics assistant. More on that soon.