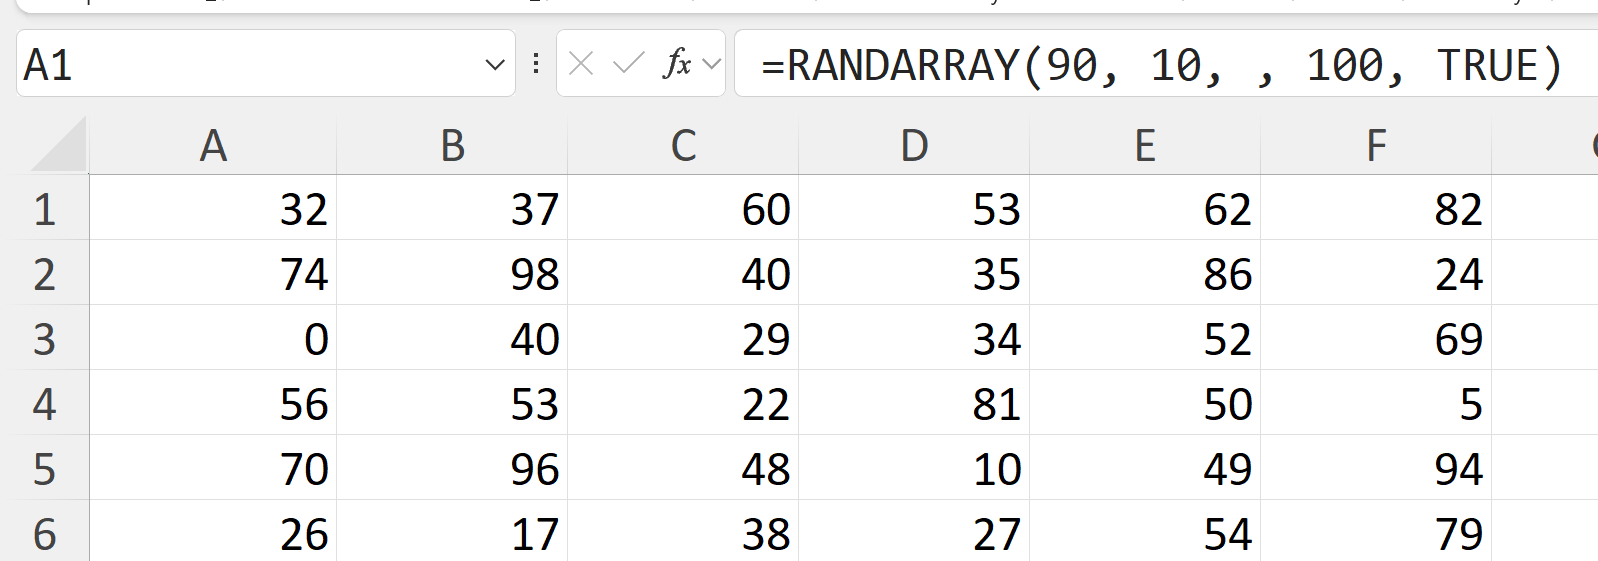
The RANDARRAY() function is one of the newer additions to Excel’s function library, providing a dynamic and versatile way to generate random numbers. Unlike the legacy RANDBETWEEN() and RAND() functions, which are limited to generating single values, RANDARRAY() offers more flexibility and efficiency, especially for business applications where random data generation is essential.
Let’s take a look at some examples in this post. You can follow along by downloading the exercise file below:
RANDARRAY()‘s syntax
The RANDARRAY() function efficiently generates random integers or decimal numbers across specified rows and columns. Its syntax is straightforward:
RANDARRAY([rows], [columns], [min], [max], [integer])
Each parameter is optional:
- rows: Defines the number of rows in the array; defaults to 1 if omitted.
- columns: Defines the number of columns; defaults to 1 if omitted.
- min: Sets the minimum value of the random numbers, with a default of 0. Useful for starting random numbers above zero.
- max: Sets the maximum value, defaulting to 1. This constrains random numbers to a specific range.
- integer: A Boolean where TRUE generates integers and FALSE (default) produces decimals between min and max.
RANDARRAY() streamlines the generation of random data, eliminating the need for multiple formulas and simplifying data layouts. It is ideal for financial modeling, Monte Carlo simulations, and preparing datasets for analysis or training, offering precision and reducing errors. This function is versatile, allowing for control over the range and type of numbers generated, and capable of creating large matrices more efficiently than RAND() or RANDBETWEEN().
Now that we’ve covered the syntax, let’s explore some practical examples.
Example 1: Sales Forecasting
Consider a marketing team needing to simulate sales data for various products over a quarter. By using the RANDARRAY() function, you can create a random dataset representing daily sales figures across different products. Suppose we need random sales data for 10 products over 90 days. Using the formula =RANDARRAY(90, 10, 0, 100, TRUE), we generate a 90×10 array of random integers between 0 and 100.
This dataset can be used to analyze trends, forecast sales, and prepare for quarterly reviews, providing a comprehensive view of potential sales patterns.
You can see this in the sales worksheet of the demo workbook.

Example 2: Risk Analysis in Corporate Finance
In corporate finance, RANDARRAY proves invaluable in risk assessment and financial modeling. Let’s say we need to simulate the daily returns of a stock portfolio over a year to analyze potential risks.
Using =RANDARRAY(365, 5, -0.05, 0.05), we generate a 365×5 array of random returns between -5% and 5% for five different stocks. This data helps in understanding the variability and risk profile of the portfolio, allowing for better investment decisions and risk management strategies.
You can see this on the risk worksheet of the demo workbook.

Example 3: Quality Control in Manufacturing
Another practical example is in HR analytics, where RANDARRAY() can help simulate employee performance scores. Suppose we want to analyze potential performance scores for 50 employees over a year. The formula =RANDARRAY(12, 50, 1, 5, TRUE) generates a 12×50 array of random integers between 1 and 5, representing monthly performance ratings. This simulated data can assist in performance reviews, identifying trends, and planning development programs.
You can see this on the quality worksheet of the demo workbook:

Conclusion
RANDARRAY() stands out for its versatility, making it an invaluable tool across numerous business applications. Unlike RANDBETWEEN() and RAND(), which generate only single random values, RANDARRAY can create entire arrays with a single formula. This capability not only saves time but also increases the robustness and clarity of your data analysis efforts.
While RANDARRAY() is exceptionally useful for generating random numbers based on a uniform distribution, it’s important to be aware of its two distinct limitations.
Firstly, if your statistical model requires different distributions, RANDARRAY() might not be the best fit, as it is limited to uniform distributions and cannot generate random numbers from other types of distributions.
Secondly, RANDARRAY() does not allow the customization of the random seed. This limitation hinders the ability to reproduce the same set of random numbers consistently, which is essential for ensuring reproducibility in your analysis.
To overcome these limitations, integrating Python with Excel can be highly advantageous. Python’s extensive libraries enable the generation of random numbers from a variety of distributions and allow the setting of random seeds to ensure reproducibility.
For those interested in further exploring dynamic array functions and their applications, I recommend checking out my book, Modern Data Analytics in Excel. This resource delves deeper into dynamic arrays and provides practical examples to enhance your Excel skills.
