As Excel users, we know our data doesn’t always just stay in Excel. We often want to push it out, maybe to send totals in an email, post updates to Teams, or trigger a notification when spending passes a certain amount. Power Automate is great for that kind of integration, but even doing something as simple as summing a column inside a flow isn’t as straightforward as it sounds.
In this post, we’ll look at two ways to do it:
- Setting up a loop in Power Automate to add up your values.
- Using an Excel-specific method that runs an Office Script to calculate the total and return it to your flow.
We’ll use a small expenses table as our example dataset. Download it below to follow along.
For this post, I’m assuming you already know how to set up basic trigger-based flows, connect to Excel workbooks in Power Automate (remember: your data needs to be stored as a table!), and work with dynamic content and Power Fx expressions.
If you’d like a refresher on these topics before diving in, check out my LinkedIn Learning course on Power Automate for Excel:
Our goal here is to add up the values in the Amount column of the expenses table in the workbook provided. Save the file somewhere easy to find in your OneDrive or SharePoint, then head over to make.powerautomate.com and create a new trigger-based flow. We’ll use it to explore how to sum this column.
Method 1: Build a loop in Power Automate
Our first step is to set up an empty variable to hold the running total. When using a loop, we need a place to store the sum as each value is added. Here we create a variable called TotalAmount, set the type to Float, and give it an initial value of 0. We use the Float type because expense amounts often include decimals, and this ensures the total is calculated accurately.

Next, we use the List rows present in a table action to pull in all the data from our Excel table. Power Automate needs access to each row so it can loop through them and add up the values. By connecting to the workbook and selecting the correct table name, the flow can read every record in that table and use those values in later steps to calculate the total.

Next we use the “Increment variable” action to add each value in the Amount column to our running total. This action increases the TotalAmount variable by the specified amount every time the loop runs.

The expression
float(items('For_each')?['Amount'])tells Power Automate to take the Amount from the current row and treat it as a number. Using float() ensures the value is recognized as a decimal rather than text. Each time the loop runs, the flow adds that number to TotalAmount, giving us the full sum once all rows are processed.
Finally, we’ll post the result to Teams so the total shows up right where the team works:

In the body of the message, we can insert our total and format it neatly using this Power Fx expression:
formatNumber(variables('TotalAmount'), 'N2')This tells Power Automate to take the value stored in TotalAmount and display it with two decimal places. It makes the output look like a proper currency figure instead of a long or uneven number, giving a clean result such as $1,234.56 in the Teams message.
Now we can test the flow and see the result in Teams, like the message shown below:

From here, you can easily expand this flow for real business uses. For example, you might schedule it to run daily or weekly to post expense updates, or add conditions to send an alert if spending passes a certain threshold. You could also connect it to other flows to log totals in a dashboard or send summaries to managers by email.
The looping approach represents the classic Power Automate method for totaling values. For instance, if your data were stored in a SharePoint list, this would be the standard and most efficient way to handle the calculation, since Power Automate is built to iterate over list items easily.
Method 2: Run Office Script
However, because our data lives in Excel, we have another option: Office Scripts. With Office Scripts, we can perform the same calculation directly inside Excel, then call that script from Power Automate without relying on loops.
If you haven’t explored Office Scripts before and want a solid introduction to how to create, store, and share scripts, check out my LinkedIn Learning course on Office Scripts for Excel.
At a high level, this Office Script gets the first worksheet in the workbook, finds the first table on that sheet, and looks for a column called Amount. It then reads all the values from that column, converts them to numbers, adds them up, and returns the total.
We’re storing this script in our Office Scripts library, which means it lives in the cloud and can be accessed directly from Power Automate. Unlike traditional VBA macros that run locally on your computer, Office Scripts are completely cloud-based, making them easy to run, share, and automate across different devices and users.
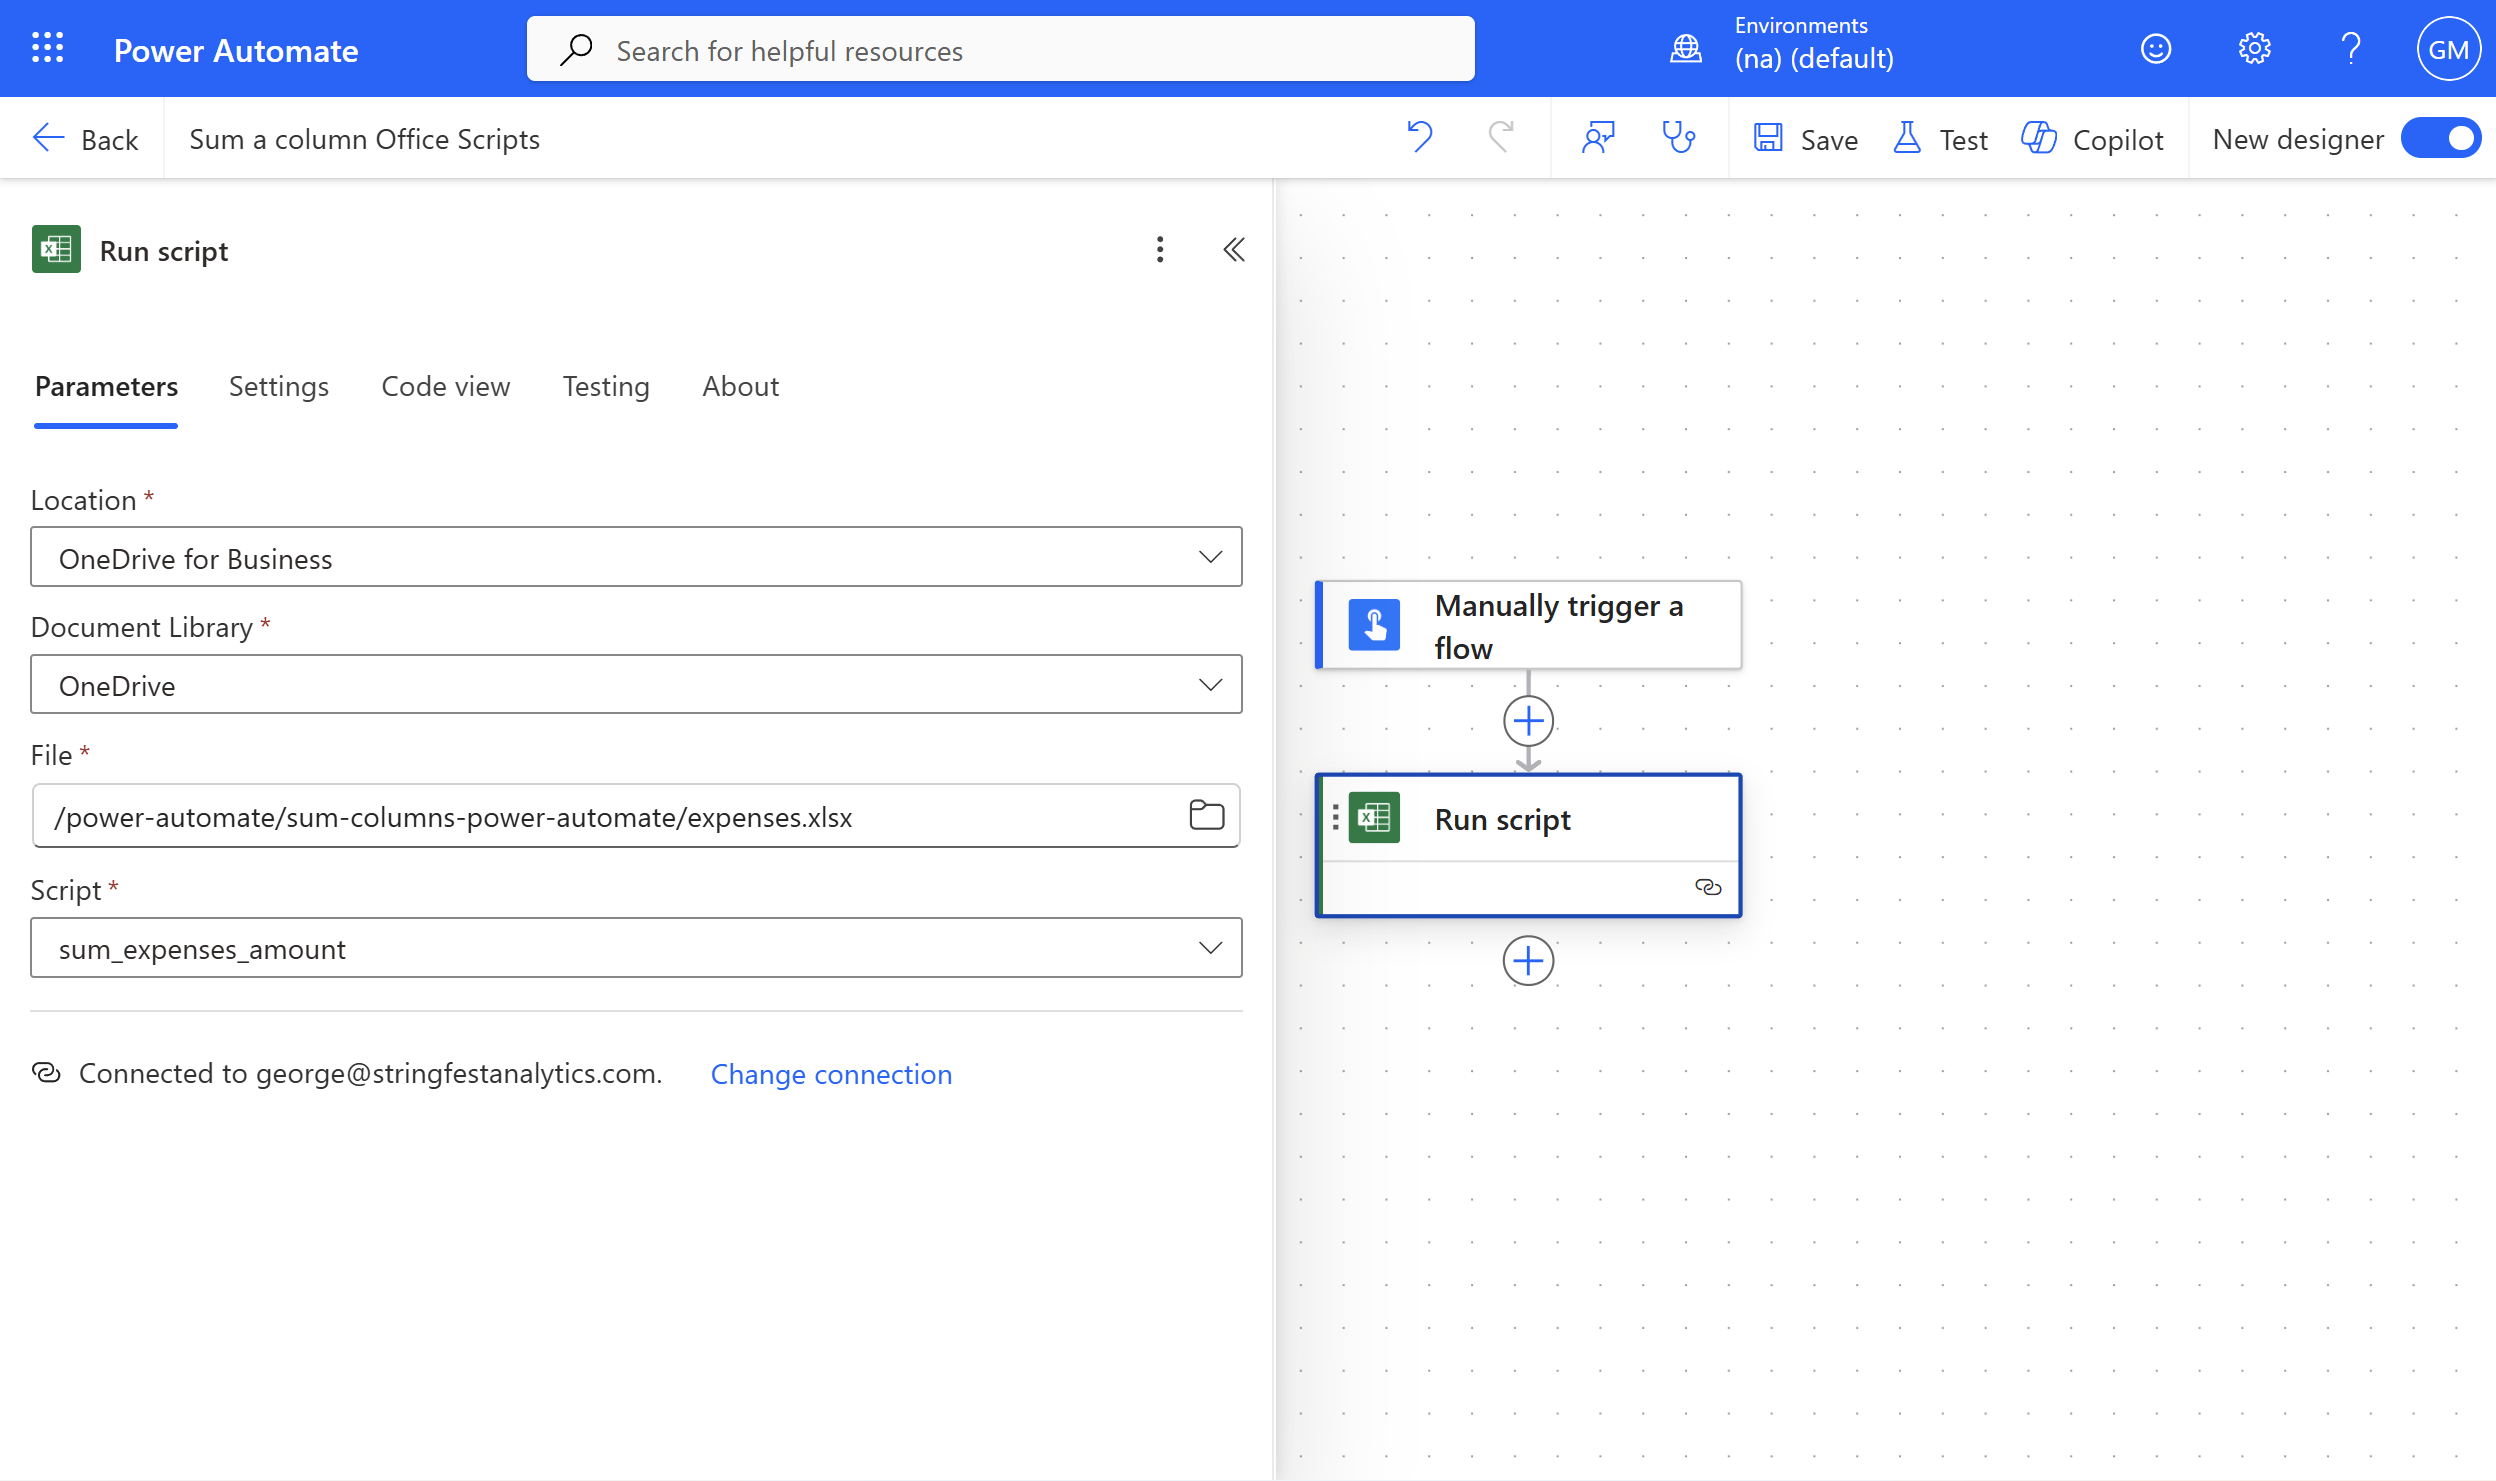
Back in Power Automate, we’ll create another trigger-based flow, but this time we’ll call an Office Script to calculate the total. All we need to do is point Power Automate to the workbook’s location and specify the name of the script we want to run.
The next step is the same as before: we’ll send the result to Teams.

This flow only takes three steps compared to five in the looping method. Does that make it better? Like most things in data, the answer is: it depends.
Conclusion
Both the loop and Office Script approaches get the job done, but they each come with tradeoffs. The loop method is the more classic Power Automate approach. It’s flexible, transparent, and easier to troubleshoot step by step. If your data were stored in a SharePoint list or another system that Power Automate natively integrates with, looping through rows would be the clear choice. However, it does take more setup and a few extra actions to build and maintain.
The Office Script method, on the other hand, is leaner and often faster. Because the logic runs inside Excel itself, Power Automate only needs to call one script and retrieve a result. The tradeoff is that Office Scripts can feel a bit more brittle if the script or table structure changes, and debugging them means switching between environments.
At a high level:
| Feature | Loop in Power Automate | Office Script |
|---|---|---|
| Setup time | More actions and configuration | Quick once script is created |
| Performance | Slower on large datasets | Typically faster, runs in Excel |
| Maintainability | Easier to edit or extend | Requires script updates if structure changes |
| Integration | Works great with SharePoint or non-Excel data | Best for Excel-based workflows |
| Transparency | Each step visible in the flow | Logic contained in script code |
If you’d like help implementing next-generation automation workflows like these for your organization’s Excel setup, or want to explore how tools like Power Automate, Office Scripts, and Copilot can streamline your reporting, get in touch: