When you think of predictive analytics, maybe you picture programming languages like R and Python or cloud platforms like Azure or Amazon AWS. The humble Excel spreadsheet is probably not top of mind — but it can serve its purpose. Let’s take a look at what XLMiner can do for predictive analytics and, by extension, AI:
Excel as data science wireframe
Predictive analytics models are complicated to build and deploy. There’s a danger to setting forth a creation you don’t really understand (ever heard of Frankenstein?). Excel offers a simple, tactile prototyping tool for constructing them. We’ll use an add-in to do most of the heavy mathematics lifting, while still getting hands-on with the data.
Installing the XLMiner add-in
XLMiner is a free add-in for statistical analysis that works on most versions of Excel, including the web. To get started, head to the ribbon then Insert > Add-ins > Get Add-ins. From the Office Add-ins menu, search for XLMiner and click Add:

Agree to the Terms & Conditions, click OK and you should see an XLMiner menu on the sidebar of your screen. As you’re seeing, XLMiner comes with plenty of statistical tools and techniques. Let’s focus on the “mother of all models,” linear regression.
Linear regression on on housing prices
We will use price as the dependent variable and lotsize, airco and prefarea as the independent variables. Head to the Linear Regression section of the XLMiner menu, fill it out like so, then click OK:

Unfortunately, it can be difficult to use the drag-and-drop feature in XLMiner to name an input range, so you may need to physically type in the cell locations.
Don’t forget the assumptions!
It can be tempting to jump right into building models and making predictions as we did, but in practice it’s necessary to explore the data and check whether it meets the assumptions of whatever model you’re using.
To be fair, Python and R provide much more robust environments for these regression checks, but if you’d like that hands-on approach that only Excel can provide, check out my book Advancing into Analytics: From Excel to Python and R. XLMiner can also provide additional outputs to help in checking these assumptions.
Evaluating the results
You should see the following output from XLMiner after running the regression:

Here you have typical regression diagnostics such as coefficient p-values, R-square and more. If you’d like to learn more about interpreting these, check out Advancing into Analytics. Aside from these measures, what kind of analytics are we doing? Is this AI?
Does this count as AI?
These days, it can seem like a data product is a snoozefest unless it’s AI-powered. So does linear regression in XLMiner count as AI? Sort of — it depends on how the regression model is used.
AI and predictive analytics
Artificial intelligence is what it sounds like — tasks done by computers that normally would require human intelligence, such as transcribing speech, detecting pictures and so forth. Predictive analytics is using data and statistical models to forecast what will happen in the future. Making predictions is a typical human task that can be done “artificially”, but few would expect humans to make predictions the way that computers do, by following a strict statistical model. That puts predictive analytics near the AI camp, but not in it.
Linear regression and predictive analytics
To make matters more complicated, we didn’t really just do predictive analytics anyway with this regression model, although we could have…

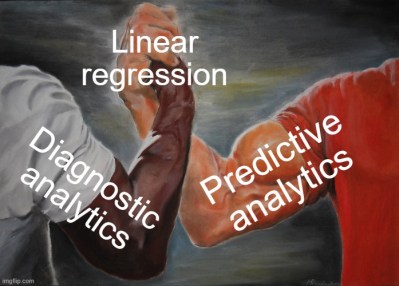
Think about how regression works: we fit a line to our data and decide how well that line describes a relationship between independent and dependent variables. This tells us about patterns in past data, but doesn’t in itself make predictions about the future. That makes basic regression a form of diagnostic analytics, or analysis about why things happened in the past.
As this article from Harvard Business School puts it:
When regression analysis is used to explain the relationships between variables in a historical context, that’s an example of diagnostic analytics. The regression can then be used to develop forecasts for the future, which is an example of predictive analytics.
As the article implies, however, it’s simple enough to turn a regression into predictive analytics — just start making predictions! Let’s try that now.
Making point predictions
To get started, we can predict the value for just one datpoint, known as a point prediction. For example, what is the predicted sale price for a home with a lotsize of 4,000, with no air conditioning and in a preferred area? Let’s plug in the coefficients and find out:

Easy enough.
However, predictive analytics usually entails making a larger set of predictions using formal performance metrics. The first step is often to split the data into training and testing sets — I show how to do that in Excel in this blog post.
XLMiner as a gateway to AI
The power that you have in using AI will only grow as you understand its foundations. So while XLMiner in itself isn’t an AI-powered tool, it’s a great tool for getting to terms with how machine learning and predictive analytics work.
What questions do you have about XLMiner and predictive analytics in Excel? How do you see the relationship between AI, Excel and predictive analytics? Let me know in the comments.
