The analysis of variance or ANOVA is a statistical test to check whether there is a difference in means across multiple groups. In particular, the one-way ANOVA checks for the difference across one variable.
Let’s demonstrate how to conduct a one-way ANOVA in Excel using abalone snail measurements.
Loading the Analysis ToolPak
The first step is to locate the Analysis ToolPak in your workbook. Navigate to the Data tab on the ribbon. Do you see something toward the end called Data Analysis?

If yes, great! If not, no worries: you can have it loaded in a few simple steps. Please note that the ToolPak is not available for every version of Excel.
Framing the problem
We will check for a difference in average shucked weights across male, female and infant abalone snails at the 95% significance level.
Preparing the data
To run this test using the ToolPak, we need to have the observations grouped by sex. We can easily do this with the help of PivotTables. Create a PivotTable by clicking anywhere in the abalone dataset, then go to the ribbon and Insert > PivotTable > OK.
Place id in the Rows section of the PivotTable, sex in the Columns and Sum of shucked_wgt in the Values sections of the PivotTable. I would also suggest suggest turning off the totals for this PivotTable by going to Design in the ribbon, then Grand Totals > Off for Rows and Columns.
You should now have something like this:

Conducting the analysis
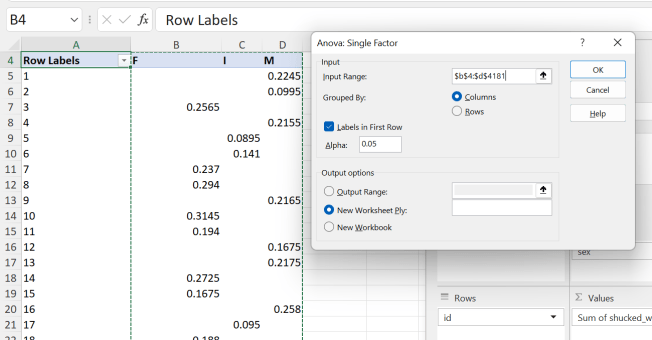
Now that the data is set up, go to Data on the ribbon, then Data Analysis > Anova: Single Factor > OK. Grab the three columns of data as your Input Range, and check on Labels in First Row. Your input menu should look something like this:

Interpreting the results
The ANOVA results will come in two boxes: the first will return some summary statistics by each group, then the second shows the results of the ANOVA. In particular, you want to check the p-value for the Between Groups variation: is it <.05?

Our p-value is quite smaller than .05, indicating that there does seem to be a difference in means across these groups.
What the ANOVA doesn’t tell us
While ANOVA does tell us that there is a difference, it doesn’t tell us where those differences are. We can do that formally by running t-tests to compare each pair of groups. Informally, a boxplot can also help identify which groups may be the differences.
Go back to the original abalone data table, select the sex and shucked_wgt columns and select Insert > Recommended Charts > All Charts > Box and Whisker. I’ll give my plot a title here:

It appears as if the I (for infant) category is the odd group out here. You can compare your results to the finished workbook below:
We can compare them with a boxplot:You can compare your workbook to the solution file here:
Have you needed to make this kind of comparison between groups before? What questions do you have about the one-way ANOVA test? Let me know in the comments.
