KPIs, or Key Performance Indicators, are essential for tracking business performance and achieving goals. In Excel Power Pivot, KPIs can provide valuable insights into your data analysis. This blog post will explore the basics of KPIs and how to use them in Power Pivot to make data-driven decisions using Major League Baseball team records:
Creating a measure
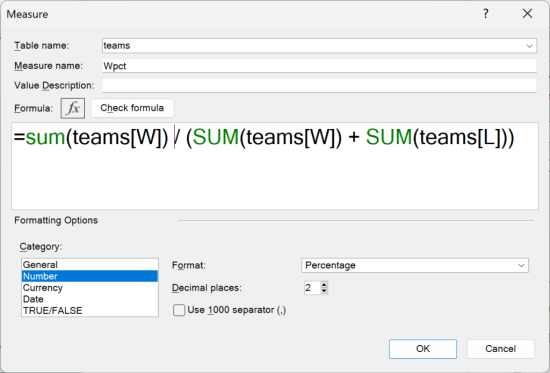
Power Pivot KPIs are based on DAX measures. For this demo, I’ve created one called Wpct to calculate winning percentage:

Inserting the KPI
With the measure of interest created, head to Power Pivot on the ribbon, then select KPIs > New KPI:

Next, fill out the KPI menu that appears.
Defining the target value
First, we’ll set the KPI’s target value, desired level of performance for the measure. A team with a perfect season would have a winning percentage of 100%. It doesn’t get any better than that. That means our target value should be the absolute value of 1:

Setting the status thresholds
Setting a target value of 1 does not imply any team is expected to reach it. No team ever has, and in fact a winning percentage of even 70% is historically rare. To account for the range of winning percentages that would be considered successful, let’s set the following thresholds:
- A winning percentage of less than 40% will be marked in red.
- A winning percentage between 40% and 60% will be marked in yellow.
- A winning percentage of greater then 60% will be marked in green.
Click and drag the thresholds in your KPI menu to match these rules:

Adjusting icon styles
Next, you’ll find several options to adjust the look and design of your KPIs, some of which may prove useful in certain situations. That said, it’s worth nothing that using red, green, and yellow as colors in data visualization is not recommended as it can cause confusion and misinterpretation for individuals with color vision deficiencies.
Unfortunately, there is no way to change this color scheme in Power Pivot, which is a major shortcoming of Power Pivot and one possible reason to migrate more sophisticated dashboards and reports to more feature-rich business intelligence (BI) tools like Tableau or Power BI.
Adding the KPI to the PivotTable
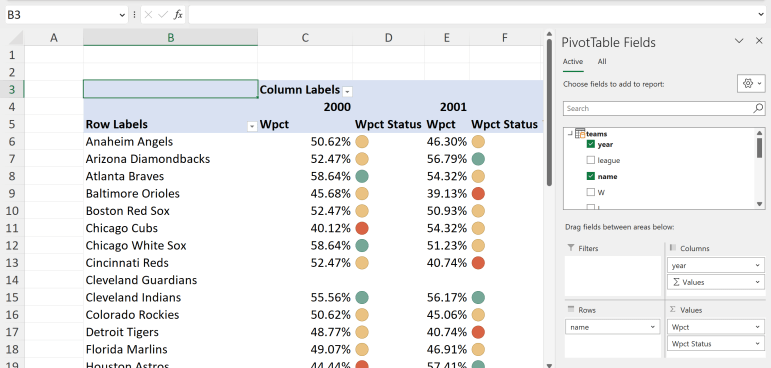
With your KPI now set up, go ahead and click OK. From there, you can insert a Power Pivot PivotTable into the workbook. Place name in the Rows area and year in Columns. Next, click the KPI dropdown under Wpct to place both Wpct and Wpct Status into Values. If you do not see the below set of percentages and icons, try deselecting and re-adding them to Values.

Adjusting the KPI
Power Pivot KPIs are essentially conditional formatting for measures: the visual icons provide visual cues to highlight and differentiate values. Scrolling through the data, you may notice that the vast majority of values are marked yellow. Perhaps we’d like more divergence about what constitutes a bad, decent and good winning percentage. To do that, let’s go ahead and redo the KPI.
Go back to Power Pivot on the ribbon, then KPIs > Manage KPIs, click on your Wpct and click Edit:

Adjust the KPI threshold to meet the following rules:
- A winning percentage of less than 45% is colored red.
- A winning percentage between 45% and 55% is colored yellow.
- A winning percentage greater than 55% is colored green.
When you’re finished, click OK and return to your PivotTable, which should now look like the following:

Adjusting the KPI like so may reveal a wider color range, but is arguably misleading as there isn’t a significant gap between average, good, or bad seasons. However, this does highlight the volatility of baseball season records.
Keeping the Power in KPIs
Power Pivot provides a powerful platform for creating and visualizing KPIs, a valuable concept for tracking performance and making informed business decisions. That said, the steps to create and main them are not so straightforward. As you look to create more sophisticated dashboards and reports, it may be worth exploring Power BI.
What questions do you have about KPIs in Power Pivot? Where have you used this to bring your data to life? Let me know in the comments.
