
Later this month I’m running a free webinar with Bayfield Training, a leading provider of real estate and financial modeling courses. Like most industries, real estate can get a big boost from solid analytics skills… especially with hands-on tools like Power BI.
For the session, Bayfield gave me this sample real estate brochure as an example. I used it to build out some Power BI insights, and it turned into a surprisingly fun use case that I wanted to share here on the blog.
We’ll start with the data cleaning in this post, and then move into visualization in the next one. The dataset we’ll be working with is on page 15 of the PDF linked below: download it if you’d like to follow along.
This dataset is basically a tenancy schedule for a commercial property. It tracks who the tenants are, how much space they occupy, their lease terms (start, expiry, rent review, break clauses), and financial details like annual rent, rent per square foot, and deposits.
In short, it’s the kind of dataset a landlord, property manager, or investor would use to monitor occupancy, rent roll, and lease risk across a building.
To kick things off, we need a way to pull the table from the PDF into a usable format. There are plenty of options for this, but Copilot at copilot.microsoft.com is a quick and reliable choice. I’ll ask Copilot to run OCR on page 15 of the PDF and upload the file as part of my prompt. From there, Copilot returns the table in a clean, structured format:

Take the table Copilot gave you and copy it into a CSV file or an Excel workbook. Just be sure to save it somewhere easy to find. Next, open Power BI Desktop and start a blank report. When choosing your data source, you’ll see the most common file types listed at the top, so just pick the one that matches your file and load it in:

The data might look pretty clean at first glance, but there are still a few things we’ll need to fix to make it easier to use in our dashboards. Go ahead and open Transform Data to start making those adjustments.

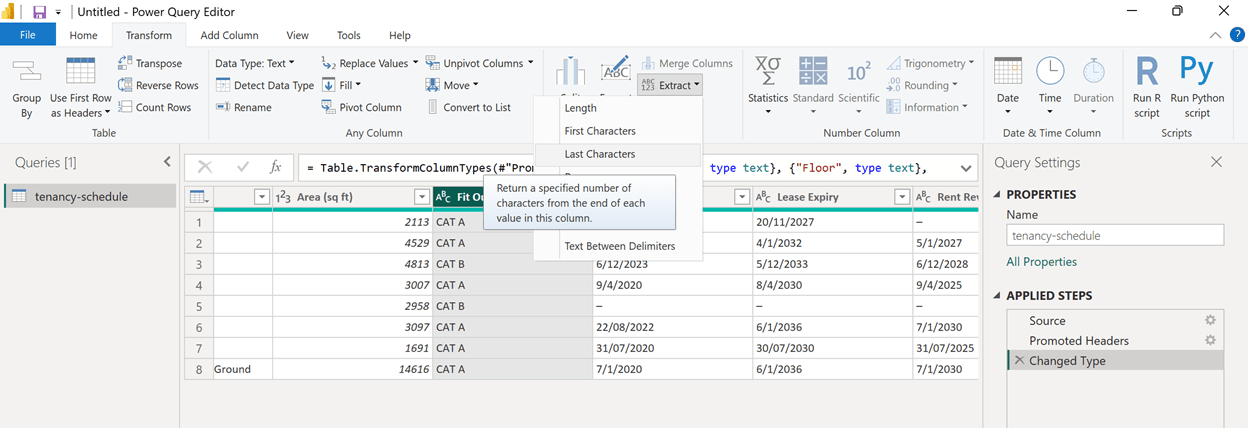
Let’s start with the Fit Out column. Instead of “CAT A” or “CAT B,” we just want the single letter. In Power Query, use Extract → Last Characters to grab the final character so the column shows only “A” or “B.”
Next I’m going to clean up the dashes that are standing in for blanks, since these can cause problems when handling nulls in Power Query. Select all the columns from Lease Start through EPC (click Lease Start, hold down Shift, then click EPC to grab them all).

Then, on the Transform tab, choose Replace Values and replace the dash (–) with nothing by leaving Replace With empty.
Great work so far! Next, let’s fix the date columns, starting with Lease Start. If you try to convert this straight to a Date in Power BI (especially in the US), you’ll hit issues because the dates are in UK format.

To handle this, click the little ABC icon next to Lease Start and choose Using Locale at the bottom. This lets you specify the exact date format convention—in our case, English (United Kingdom)—so the dates load correctly.
Now we’ll set this column to Date, making sure to use the UK locale so the format is interpreted correctly.

Now that we’ve fixed one column, let’s apply the same change to all the date columns. You could do this one by one, but this is a great chance to use the formula bar in Power Query and write a bit of M code. Paste the code below into the formula bar, and all four date columns will be converted in one step:
While we’re at it, we should also clean up the Rent per Year and Rent per Square Foot columns. These are decimal values, but because they include the GBP symbol they can cause confusion if left as-is. Instead of fixing them one by one, we can extend the same M code and specify these two columns as numbers.
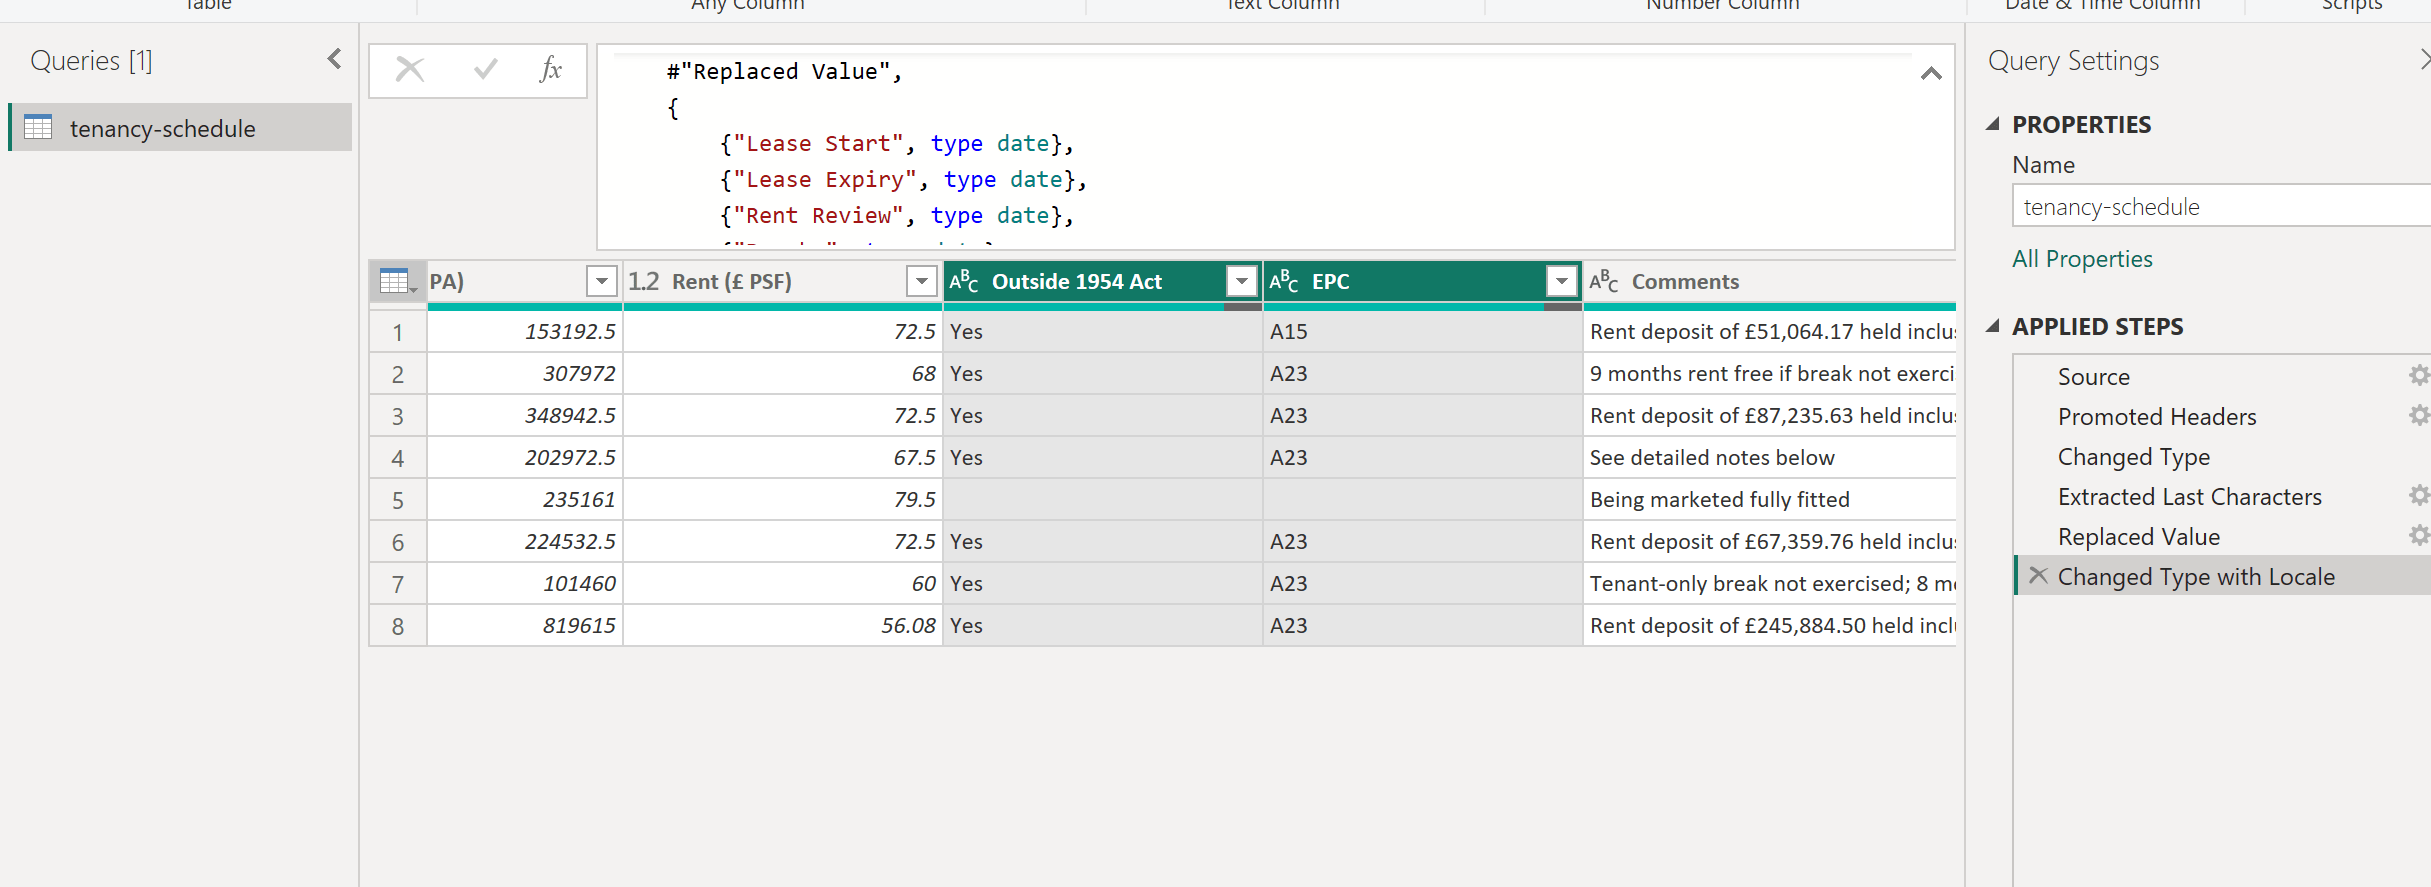
Everything’s shaping up nicely! One thing I did notice, though, is that a couple of values in the Outside 1954 Act and EPC columns are showing up as blanks instead of proper nulls. Power Query has a dedicated null keyword for empty values, and it’s best to use that so the data behaves consistently.
So how do we get those blanks converted to true nulls?
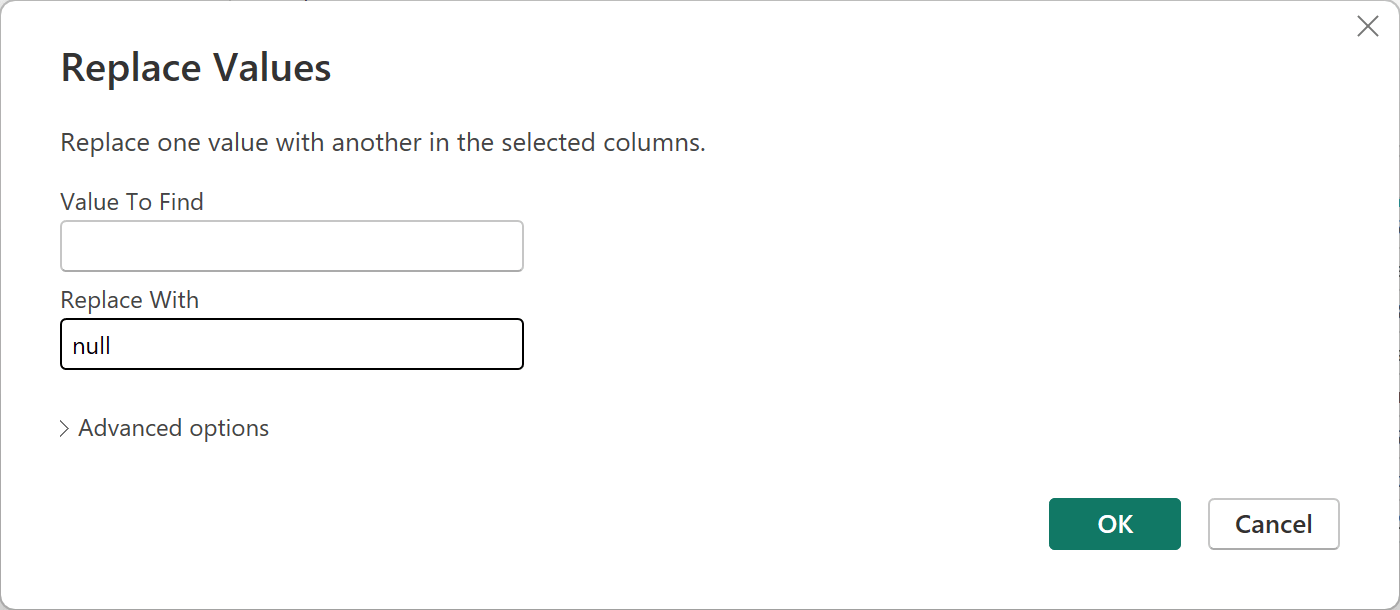
This part feels a little counterintuitive. To fix the blanks, select the columns, go to Replace Values, and leave the “Value To Find” box empty. For the replacement, type in null. That tells Power Query to treat those blanks as proper nulls.
And that’s it! Our dataset is now in much better shape for building a dashboard in Power BI with the nulls handled and the columns formatted correctly. If you want to be extra tidy make sure to convert the . We’ll cover that in a future post. For now, you can download the completed workbook below:
That’s it for the data cleaning step! We’ve taken our tenancy schedule from a raw PDF table to a much tidier dataset that Power BI can actually work with.
In the next post, we’ll build on this foundation and start creating a basic real estate analytics dashboard. We will use the cleaned data to explore things like occupancy, rent per square foot, and upcoming lease events, turning this dataset into insights you can actually act on.
Stay tuned! It will get fun once the visuals come in 📈