
As Excel users, we spend a lot of time reporting on data across different teams, formats, and audiences. We’re expected not just to crunch numbers but to generate insights and communicate them clearly. What if AI could help with that?
In this post, we’ll look at how to build an AI-powered Excel report using the AI Builder in Power Automate. To keep things simple, we’ll start small with a workflow that’s triggered manually and outputs a formatted summary of a well-known vehicle dataset. From there, you can expand the flow to refresh data automatically, send approvals, or even generate visuals, but it’s best to start with the basics.
Download the exercise file below and follow along to build your first AI-driven Excel report.
The very first thing we need to do is get this data into the Dataverse. That’s where AI Builder looks for data to analyze. I’d suggest using Dataflows for this step since it gives you a dynamic pipeline that automatically stays up to date as your data changes.
If you haven’t worked with Dataflows before, check out my post on how to set them up. Once your data is loaded, you can name the table autompg in Dataverse. That will make it easier to reference later when we build our AI-powered report.
Next you’ll fire up Power Automate at make.powerautomate.com and for the ease of simplicity start an Instant Cloud Flow. If you’re not familiar with these steps, I’d suggest checking out my LinkedIn Learning course on Power Automate:
Add a step after manually triggering a flow. From the AI Builder group at the top, choose Run a prompt (or search for it). This lets you use generative AI right inside Power Automate to summarize data, rewrite text, or generate insights using values from earlier steps. Learn more at learn.microsoft.com/ai-builder/overview or start a trial at learn.microsoft.com/ai-builder/ai-builder-trials.

Now, just like any other step in a Power Automate flow, you’ll need to define a few parameters. In this case, it’s the prompt to run. Choose Custom prompt. There are some built-in templates, but it’s best to provide as much context as possible so the AI understands your audience and intent.

Here’s an example prompt you can use in AI Builder to describe your dataset and the tone you want for the report. Paste it into the Prompt instructions box on the left.
As you build your prompt, start by giving it a clear, searchable name at the top. Then, make sure to connect it to live data from Dataverse so your flow stays dynamic.
To do this, click Add content at the bottom of the prompt box (or press the / key). Switch to Dataverse, locate the autompg table, and select the autompg attribute. This will pull in all records from the dataset and keep your AI Builder prompt connected to the latest data.

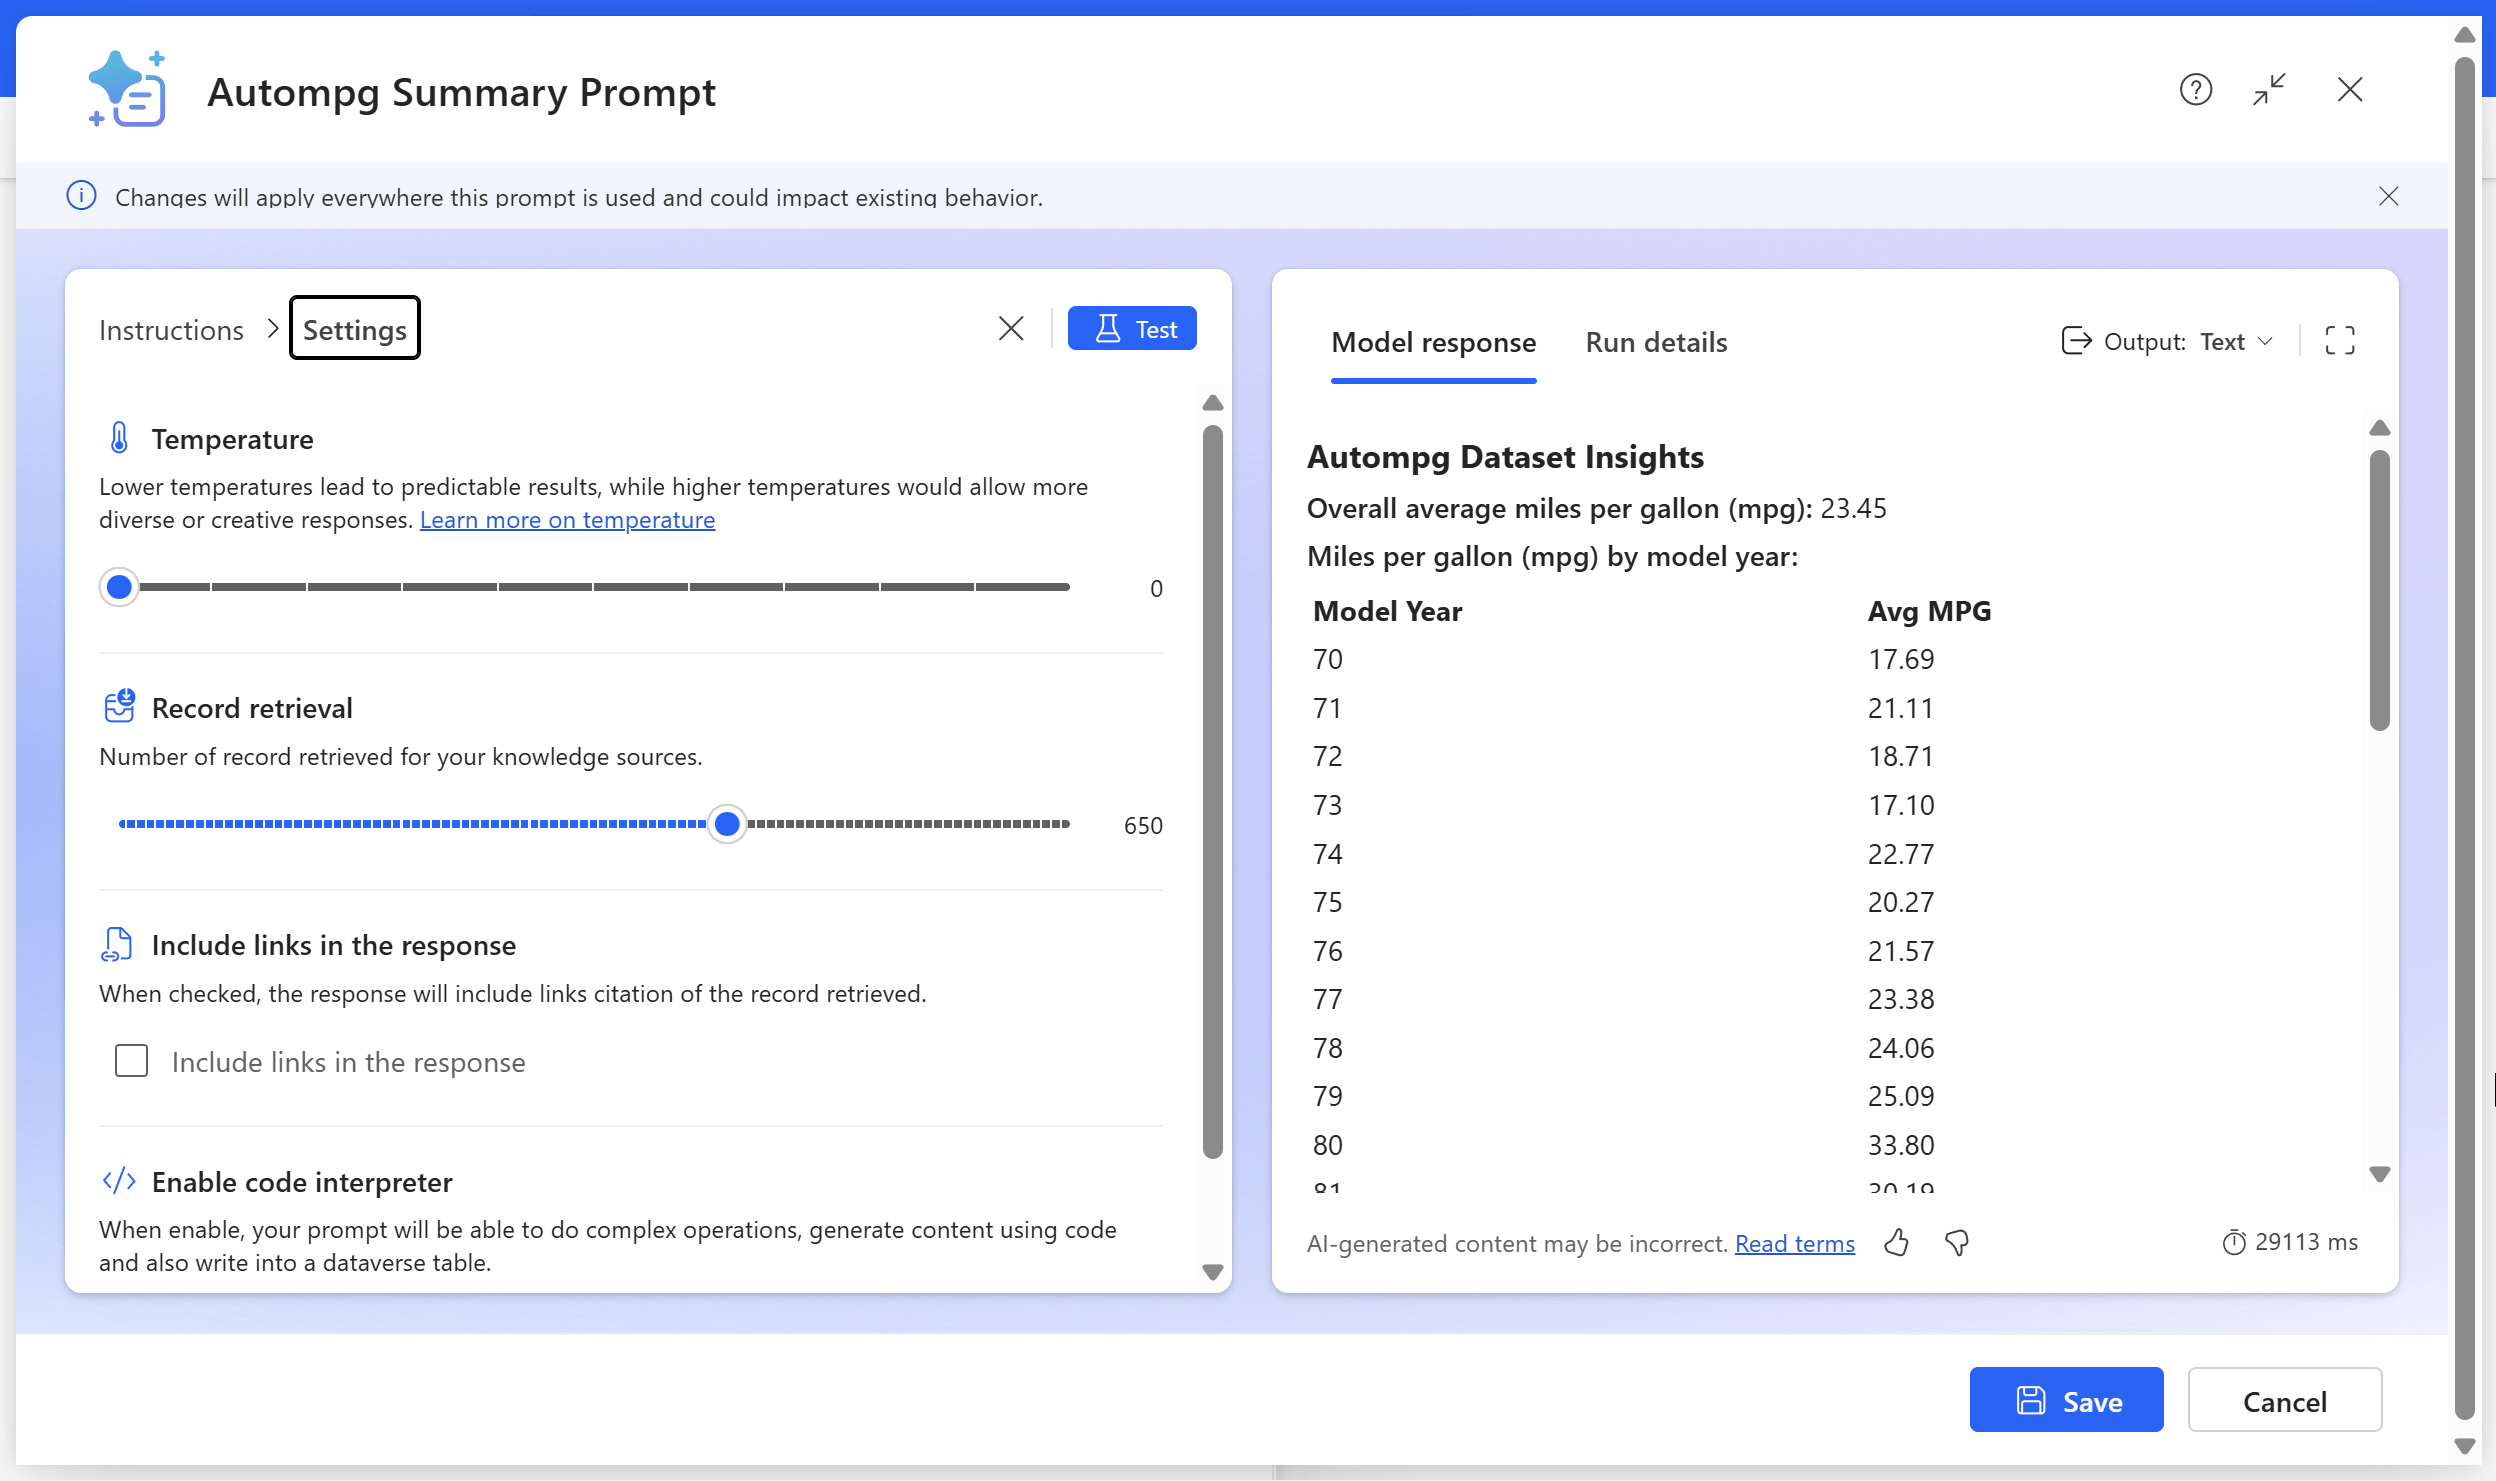
Before testing the prompt, make a few quick adjustments. Click the three dots (…) and select Settings. Increase the record retrieval limit to around 400 or more to ensure all rows in the dataset are included. Then turn on code interpreter, which allows the system to run calculations, generate charts, and analyze your data more effectively within the flow.

Go ahead and test the results. you should see something like the below.
It looks great, but freeform text output can be unpredictable. One way to control that is by lowering the temperature, but since it’s already at the minimum, we’ll need another approach. The solution is to add structure by mapping the output into JSON. This gives the model a clear format to follow, which helps produce consistent, reliable responses every time you run the flow.
To do this, change the Output format on the right side of the prompt builder from Text to JSON, then paste in the setup below. Be careful not to break the live connection to the autompg table in Dataverse.
Go ahead and re-test the prompt. You’ll notice the output looks quite different this time. The JSON format might seem messy at first, but that’s actually a good thing. It breaks your results into clear, structured building blocks, making them much easier to parse and reuse in the next step of your flow.

For this next step, we’ll take the JSON output and display it in an adaptive card. An adaptive card is a dynamic, interactive message format that can be shown in Teams, Outlook, or other Microsoft 365 apps. It’s a great way to present structured data clearly.
Instead of showing a block of raw JSON, users see a formatted, readable summary with key insights and buttons for actions. This makes your flow outputs easier to share and understand. If you want to explore adaptive cards in more depth, check out this post:
That means the third step in our flow will be to post an adaptive card to Teams. Specify the channel and any other details about where it should go, then for the Adaptive card parameter, paste in the information below:
Make sure to map your dynamic content to the correct values in the adaptive card code. Keep the quotation marks! They define where your live data goes and removing them can break the card’s structure.

Finally, save and test your adaptive card. You should see something like this in Teams:

Each time you run the flow, the results might vary slightly since it’s using generative AI, but the overall structure will stay consistent. That consistency is a good sign: it means our JSON formatting is working, and we can now fine-tune the look and layout through the adaptive card code.
Now that you’ve built your first AI-powered Excel report, you’ve got a solid foundation to build on. From here, you could add an approval process that routes the report to a manager in Teams before sharing, or schedule the flow to refresh and update the data automatically in Dataverse.
And this flow is just the beginning. Imagine generating monthly summaries automatically, sending alerts when key metrics drop, or creating follow-up tasks based on AI-generated insights. The possibilities go far beyond reporting. This opens the door to a smarter, more connected analytics process across your organization.
What other use cases could your team benefit from? Book a discovery call and let’s explore how to bring AI-powered reporting and automation into your workflows: