Special thanks to Alan at Computergaga for inspiration on this post.
One of the first days at a new job, I was sitting with a coworker going over a spreadsheet. As I went to type in =SUM( to add a range of cells, my coworker stopped me:
“You don’t need to do that — just look down to your right!”
Indeed, the range’s sum along with a few other statistics were displayed in what is called the status bar. Nice!
Recently, I learned that’s not the end to the status bar’s magic. Not seeing min/max statistics on your status bar? Simply right click to “Customize Status Bar” and select other statistics along with some other options.

In search of stats…
While our current status bar is an improvement and certainly a time-saver, I’d like to be able to see a few more statistics with the mere highlight of a mouse.
In particular, while the status bar gives us a numerical count of our range, I want to more precisely see the number of blanks in a range.
Moreover, I would like some more information on the statistical properties of our range, including skewness, kurtosis, and standard deviation.
While these are not included in the Customize Status Bar menu, we’ll find a way using VBA.
[Interested in learning VBA? I suggest my friend Jon Acampora’s VBA Pro Course.]

Please note that I am an affiliate of Jon’s course and receive a portion of any sales generated with the above links.
How to customize the status bar:
To add these statistics to the status bar, we write these functions in a VBA module, then use the Worksheet Selection event to run when a selection is made:
- Open the VBA Editor: Alt + F11
- Insert a module into the active workbook by clicking the Insert menu and selecting Module.
- Copy and paste the below code into the module:
This code calculates our four statistics and tells Excel what to display upon calculation. Calculations of skewness and kurtosis are not possible (or meaningful) without at least a handful of numbers, so the code only displays these statistics if at least 5 cells are populated.
Your Editor should look like this:

Next, we tell Excel to run the code when a range is selected:
- From the VBA Editor, double-click the worksheet on the project explorer that you want to run the code from.
- Copy and paste the code into the event procedure as shown below:

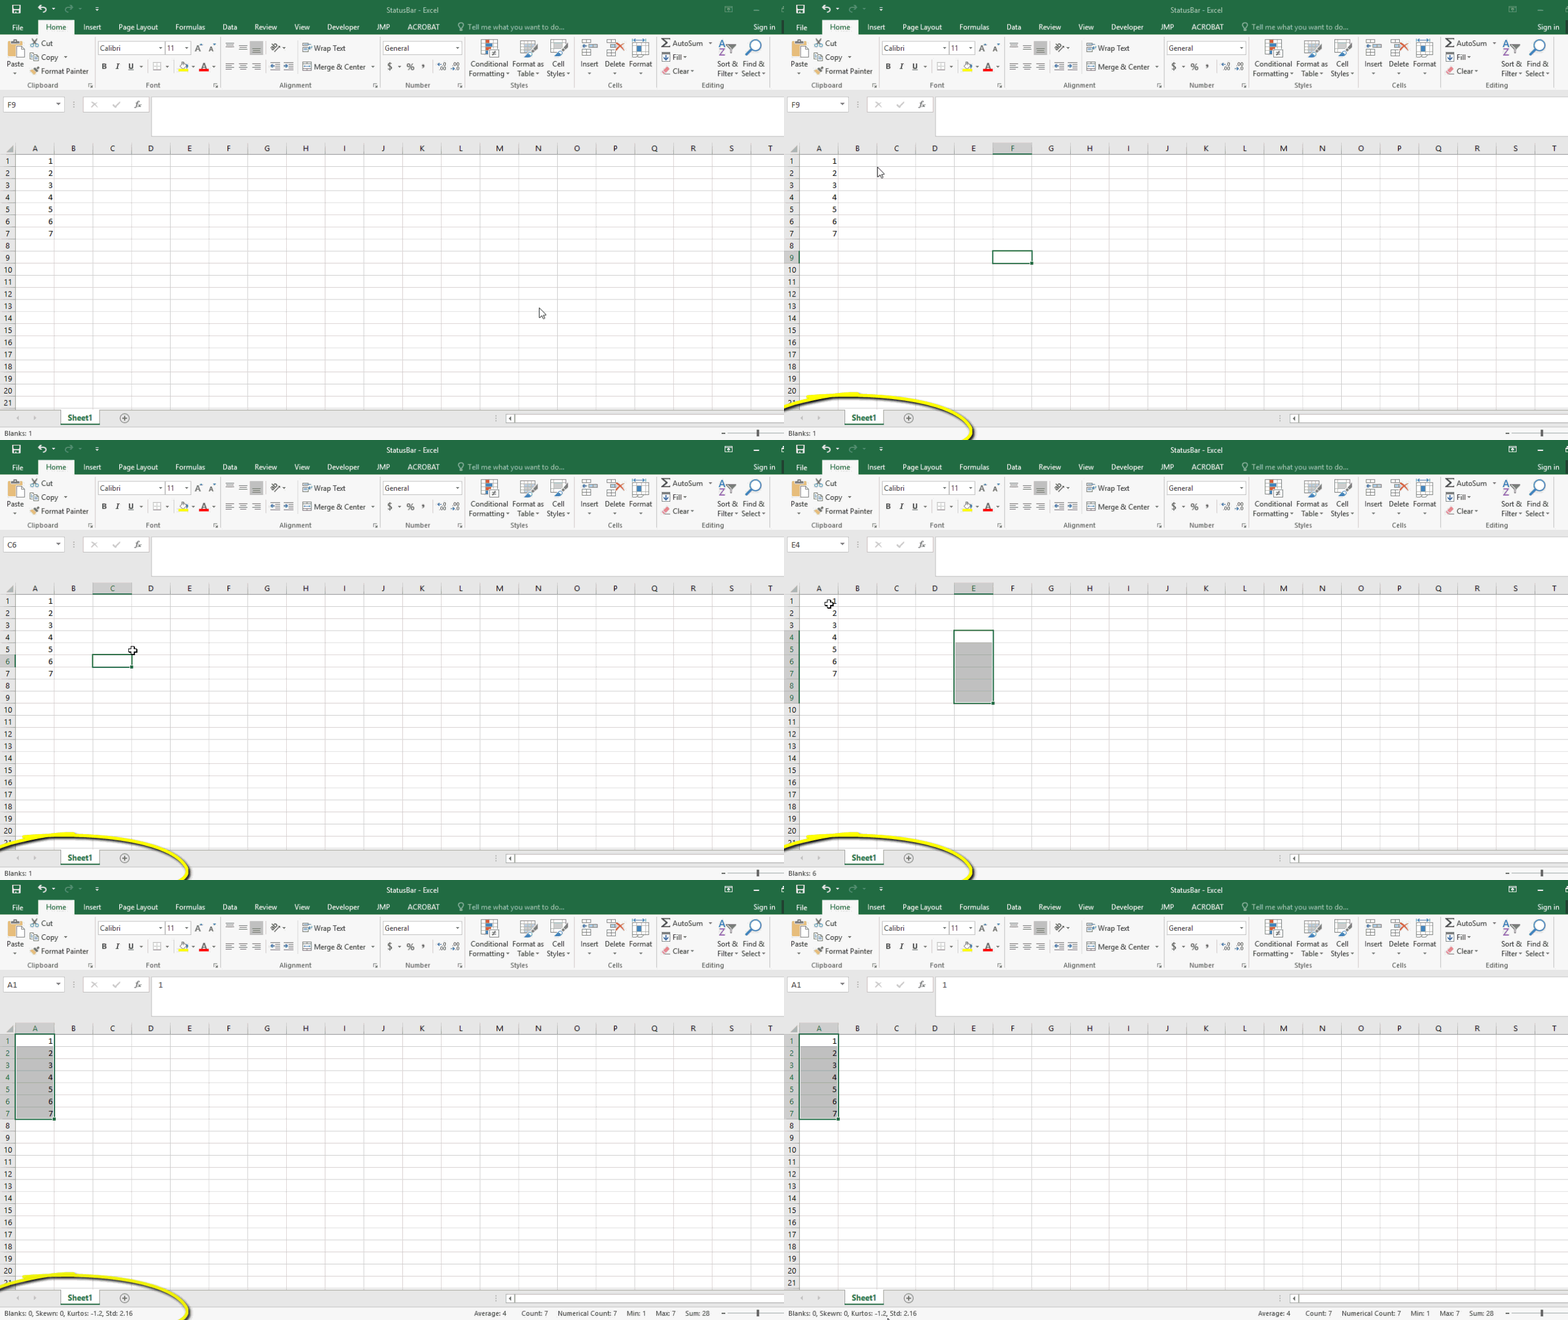
You should then see these extra statistics on the left-hand side of the status bar:

Downsides? You must include this VBA code in any individual workbook for which you want to get these measures. (From what I’ve tried, I was not able to get this working as an add-in — and I’d be happy to be proven wrong.)
What other measures would you like to see available in the status bar?
Leave a comment below, or post it to Excel’s official suggestion box.
