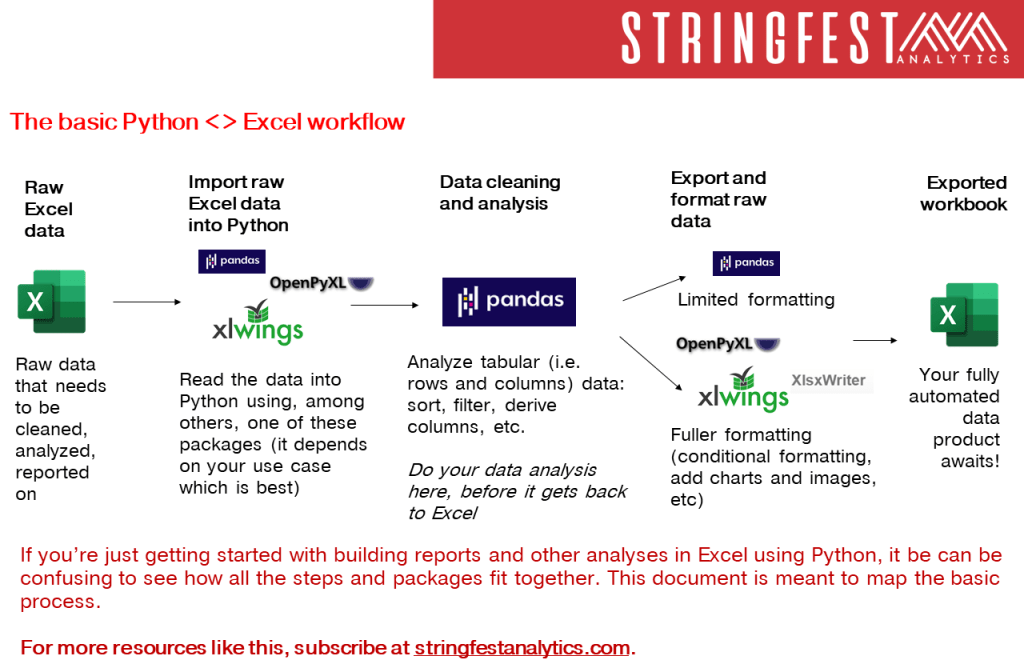
If you’re just getting started with building reports and other analyses in Excel using Python, it be can be confusing to see how all the steps and packages fit together. This post and accompanying visual is meant to map the basic process. If you’re not familiar with the concept of packages in Python, check out this post.
There are many possible use cases for pairing Python and Excel. For example, you might read data in to perform statistical analysis, and then write the findings to Excel. Or perhaps you want to connect to an API in Excel using Python functionality. The right packages and workflow will vary depending on these use cases.
For this workflow, I’m assuming that you have data residing in Excel that you wish to do something with, perhaps clean and summarize in some way. After that’s done, you want to write it back to Excel and you may want to include features like conditional formatting or charts in that output.
The following sections dig into that basic workflow, which is also depicted by following graphic. You are welcome to download it as a PDF. For access to my resource library, which contains many resources like this, subscribe to my newsletter.

Raw data
For this post we’ll assume the data you want to work with is coming from Excel. It’s worth pointing out, however, that Python can import data from many other sources, such as spreadsheets and CSV files, databases and web pages, or even video and audio.
In any of these cases, the raw data rarely lives inside Python in itself; rather it’s imported from another source, operated on in some way, then usually exported elsewhere.
Import into Python
Knowing that, how does Excel data get into Python? pandas, openpyxl and xlwings are some good bets here. If the data you’re reading in lives in a row-column format, and your goal is to operate on it further, you may consider pandas as you’ll be using it again in the workflow.
Data cleaning and analysis
You’re not going to get far with tabular data in Python without pandas. From sorting and filtering to calculating columns and working with dates, this is the package to clean and manipulate data.
Of course, you can perform many of these steps in Excel as well. So should you use pandas or Excel? I’d suggest in this workflow to do all data cleaning, manipulation, analysis, etc. before it gets to Excel. It’s not a good idea to make ad hoc changes to your Excel work once it’s left Python — a big idea of using Python in the first place was to automate everything.
Moreover, pandas provides an easy and fast environment for data analysis. You want to think of your dataset as one uniform DataFrame to be worked on and exported, rather than individual pieces of it derived and formatted such as in Excel.
Export and format raw data
OK, now that you’ve done your data work, it’s time to move the results to Excel. What package to use depends in part on how much formatting you need in Excel. For example, while pandas can write raw data to Excel, it can’t really change the format or properties of the resulting workbook. Think of things like borders, charts, or conditional formatting. To add these elements to Excel, you’ll need to use something in addition to pandas such as xlwings or xlsxwriter.
Exported workbook
Awesome, your work is now in Excel! While you could continue making changes to the workbook, remember that nearly anything you can do in Excel, you can automate with Python. So rather than manually setting up that report next week, considering writing a reproducible Python script.
References and other resources
I hope this post oriented you toward using Python for Excel and got you excited for the many possibilities. As a next step, I’d first suggest subscribing to my newsletter for more content like this.
After that, head to wherever you get your books for the following, both from O’Reilly Media:
- Python for Excel by Felix Zumstein. This book dives into working with these applications together in fine detail. By the end, you’ll have a better sense of what package to use for what task.
- Advancing into Analytics by George Mount (yes, that guy!). If you’re interested in statistical analysis and data science, this book will show you how to do it with the specific experiences of Excel users in mind.
- Check the documentation of the package! You may be curious to know whether X package has Y functionality. The best way to find out is by checking the package’s documentation. This is one of five first steps to take in getting unblocked with Python.
